Pathways to Excellence in Physician Practices & Behavioral Health
The Pathways to Excellence process for physician practices and learn how to utilize it for Behavioral Health. Gain insights into health data experiences, quality care challenges, and cost comparisons in healthcare.

Download Presentation

Please find below an Image/Link to download the presentation.
The content on the website is provided AS IS for your information and personal use only. It may not be sold, licensed, or shared on other websites without obtaining consent from the author.If you encounter any issues during the download, it is possible that the publisher has removed the file from their server.
You are allowed to download the files provided on this website for personal or commercial use, subject to the condition that they are used lawfully. All files are the property of their respective owners.
The content on the website is provided AS IS for your information and personal use only. It may not be sold, licensed, or shared on other websites without obtaining consent from the author.
E N D
Presentation Transcript
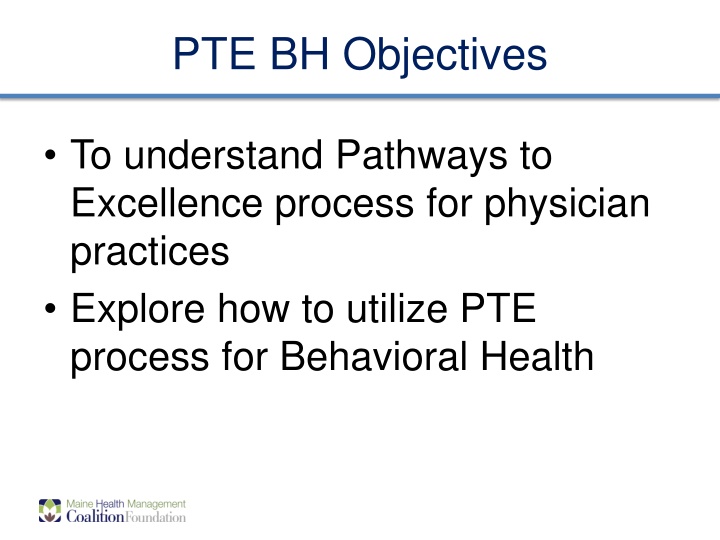
PTE BH Objectives To understand Pathways to Excellence process for physician practices Explore how to utilize PTE process for Behavioral Health
Experience with Health Data: It is both less and more complicated than what people say. Maine Health Data Organization Board, 1997 to 2002, 2009 - 2013. Maine Health Information Center/Onpoint Board, 2003- 2010 Maine Data Processing Board 2007-08 AHRQ Healthcare Cost and Utilization Project Steering Committee, 2010- 2012 NCQA Committee on Performance Measurement, 2009 - 2011 National-Regional Workgroup of the Quality Alliance Steering Committee, 2008 - present National Quality Forum: Workgroup on Patient Reported Outcomes Measures, 2012-13 2
Our Quality Is Less BETTER 3 3
Our Costs Are More International Comparison of Spending on Health, 1980 2010 Average spending on health per capita ($US PPP) Total health expenditures as percent of GDP 18 $8,000 US SWIZ NETH CAN GER FR AUS UK JPN 16 $7,000 14 $6,000 12 $5,000 10 $4,000 8 US NETH FR GER CAN SWIZ UK JPN AUS $3,000 6 $2,000 4 2 $1,000 0 $0 1980 1982 1984 1986 1988 1990 1992 1994 1996 1998 2000 2002 2004 2006 2008 2010 1994 1980 1982 1984 1986 1988 1990 1992 1996 1998 2000 2002 2004 2006 2008 2010 Notes: PPP = purchasing power parity; GDP = gross domestic product. Source: Commonwealth Fund, based on OECD Health Data 2012.
Problems with UnderUse 2004: Adults receive about half of recommended care Adherence to Quality Indicators Breast Cancer 75.7% Prenatal Care 73.0% Low Back Pain 68.5% Coronary Artery Disease 68.0% 54.9% = Overall care 54.9% = Preventive care 53.5% = Acute care 56.1% = Chronic care Hypertension 64.7% Congestive Heart Failure 63.9% Depression 57.7% Orthopedic Conditions 57.2% Colorectal Cancer 53.9% Asthma 53.5% Benign Prostatic Hyperplasia 53.0% Hyperlipidemia 48.6% Not Getting the Right Care at the Right Time Diabetes Mellitus 45.4% Headache 45.2% Urinary Tract Infection 40.7% Ulcers 32.7% Hip Fracture 22.8% Alcohol Dependence 10.5% 0% 20% 40% 60% 80% 100% Percentage of Recommended Care Received Source: McGlynn EA, et al., The Quality of Health Care Delivered to Adults in the United States, New England Journal of Medicine, Vol. 348, No. 26, June 26, 2003, pp. 2635-2645 5
MHMC 1995 quality / outcomes + Value: change in health status + employee satisfaction Cost Best quality health care - B Best outcomes and quality of life - D Most satisfaction - B For the most affordable cost D- soon to be B+ For all Maine citizens - A 6
All Started With Depression - 1998 Employers saw depression crop up in all benefit programs (WC, GH, STD, LTD, Abs) Ran EAP programs, but needed health system 1999-2000 MHIC Led Nurse Telecare initiative with 14 PCP practices Improvement in med adherence, Hamilton Scores, SF-12 scores, and Household, Work, & Leisure Time Functioning Productivity went up (but no one knew it), practices lost money (no one paid them), and drug costs increased
What To Do? Employers couldn t just focus on one disease Seemed like chronic illness went together Started initiative focused on depression, diabetes, CVD, & asthma Informing Patients & Rewarding Providers
3 Basic Aspects of Quality Type of Measure Structure Definition Examples The opportunity exists to obtain good care. Right number / mix of providers. (e.g. PCP, specialists, MSW, etc.) Computerized Rx physician order entry Process Interpersonal Interventions are humane and responsive to patients preferences Testing/treatment choices explained Patients get questions answered Process Technical Interventions are provided skillfully to the people who need them Evidence-based guideline compliant treatment Right tests Right Rx, treatments etc. Outcomes: clinical, functional, financial The best possible clinical and patient results are achieved. Normal lab values Patients live Symptom free days Patients function more effectively at work, home, and play 9
3 Basic Aspects of Quality Rooney s view using CPDP Criteria Type of Measure PCPs Specialties Hospitals ACOs Structure Good Good Good Good Process Interpersonal Coming 50% Coming 25% Good Good Process Technical Good for most processes Good for most processes Poor except Cardiology Good Outcomes: clinical Good 50% Poor Poor Developing Outcomes: Functional/Pop Hlth Poor Poor Poor Developing Outcomes: financial Total Cost of Care/Util. Onpoint &/or Aetna Total Cost of Care Prometheus 10
PTE Evolution - Diabetes 2005: Practices measuring HbA1c, BP, LDL 2006: Practices with measures on 85% of patients with diabetes 2007: Achievement of certain outcomes of care
Pathways to ExcellencePhysicians Steering Committee 2014 Health Plans Med. Directors: Aetna Anthem CIGNA Harvard Pilgrim MaineCare Practice Leaders: Jeff Aalberg, MD: MMC PHO Bob Allen MD: PCHC Michael Bergeron, MD: St. Mary s Frank Bragg, MD: EMMC Tom Claffey, MD: InterMed Ned Claxton, MD: CMMC Barbara Crowley, MD: MaineGeneral Marcus Deck, MD: Bowdoin Med Gp Rich Engel, MD: Greater Portland MG David Howes, MD: Martin s Point Lisa Letourneau, MD: Quality Counts Jay Naliboff MD: Franklin Gary Ross DO: MNH, Brewer John Yindra MD: DFD, MCHO Employers/Plan Sponsors: Christine Burke: MEA Benefits Trust Chris Brawn: State Employee Health Plan Tom Hopkins: Univ. Maine System Chris McCarthy: Bath Iron Works Steve Gove: ME Municipal Health Trust Joanne Abate: Hannaford Bros. 12
2013 Clinical Outcomes Structure-Process Interpersonal Process
MHMC 2004 Incent Patients and Providers High Effective & Inefficient Effective & Efficient Quality Ineffective & Inefficient Ineffective & Efficient Low Costs High Low Efficiency w/o Quality is Unthinkable Quality w/o Efficiency is Unsustainable 14
Health Plan - Employer Use State of Maine Tiered Networks Hospital based on PTE Metrics 2006 Waive $300 co-pay PCPs based on PTE 2-3 Blue Ribbons July 2007 Waive $10 co-pay and deductible on office visits Deductible & co-pay waiver for diabetic pilot 15
Current PTE Participation 2007 2008 % Ch Practices 3 Blue Ribbon 131 171 + 31% 2 Blue Ribbon 59 71 + 20% 1 Blue Ribbon 70 69 -1% 0 Blue Ribbon 169 125 -26% 17
Maine: 2nd biggest improvement in US
2009 TOTAL SCORE 2005 Total 2005 Pie 2006 Total 2006 Pie 2007 TOTAL 2007 PIE 2008 TOTAL 2008 PIE 2009 PIE Medication Survey Results 2005-2009 (as of 8-09) Parkview 21 52 91 96 97 Mayo Regional Hospital 13 26 53 74 93 Down East Community Hospital 21 22 33 46 91 Miles Memorial 24 25 66 71 90 Mercy Hospital 29 33 83 96 90 Cary Medical Center 29 44 78 68 85 St. Andrews 0 2 5 63 84 Mount Desert Island Hospital 21 44 76 75 84 York Hospital 13 19 63 72 82 Stephens Memorial Hospital 19 27 65 81 81 Rumford Hospital 0 13 57 66 79 Eastern Maine Medical Center 30 25 71 79 78 Central Maine Medical Center 26 38 67 80 78 Penbobscot Bay Medical Center 13 8 54 73 78 Maine Medical Center 35 35 71 77 77 Southern Maine Medical Center 21 27 65 61 76 Blue Hill 0 21 42 67 75 Maine Coast Memorial Hospital 7 23 68 72 73
Bridgton Hospital 24 24 62 73 73 Franklin Memorial 0 29 56 50 72 Midcoast Hospital 32 35 70 74 71 MaineGeneral Medical Center 28 35 63 68 71 Sebasticook Valley 0 26 60 70 71 The Aroostook Medical Center 5 6 63 70 71 Northern Maine Medical Center 0 36 74 73 70 St. Mary's R.M.C. 23 23 44 54 68 St. Joseph Hospital 9 28 59 57 67 Inland Hospital 0 21 59 66 66 Penobscot Valley Hospital 14 31 42 57 66 Goodall Hospital 9 14 67 57 58 Calais Regional Hospital 31 38 61 54 57 Redington Fairview 18 17 36 32 52 Millinocket Hospital 0 27 52 43 52 Houlton Regional 7 12 24 25 52 CA Dean 1 1 1 34 47 Waldo County General Hospital 0 10 48 43 45
State Employee June, 2008 My blood sugar numbers were in 400 s. Scary! My A1C was 9.7, now it is below 7.5 What made me go: 1. Not having to pay co-pays on my medications for a year That was incentive to get me in door 2. Even with $ incentive, I wouldn t have kept coming back if the staff were punitive or judgmental, or had unreasonable expectations. Every staff person .was helpful, understanding, and reasonable. 21
Aligning MainesForces QC/MHMC: AF4Q Consumer Messaging/ Consumer Engagement Leadership MHMC Employee Activation Program MHMC : PTE reporting on hospitals, primary care, specialist quality MQF: reporting on hospital quality, patient experience of care (TBD) Perf Meas./ Public Report Quality Improvement MPIN, PHOs: QI support to mbr practices Quality Counts: QC Learning Community MHMC: Encourage employer/payer use of PTE data for steering; Value-based insurance design Benefit Design Maine PCMH Pilot Hospitals/ Health Systems & Employers: Local ACO Pilots Payment Reform BIW Primary Care Program Primary Care & Employers/Payers: Alternative payment models Cognitive Consultation Specialty Care: Alternative payment models Promote Health IT Adoption MEREC: Promote primary care HER adoption, meaningful use HealthInfoNet: Promote interoperable systems Bangor Beacon: promote community-wide, connected HIT
Univ. Wisconsin - RWJF County Health Rankings What Contributes to Health Outcomes? Employers & Consumers Get This But What to Do?
Maine PCMH Pilot Community Care Teams Schools Transportation Environment Housing Outpatient Services Workplace Care Mgt Family Community Resources Food Systems High-need Individual Med Mgt Specialists PCMH Practice Shopping Coaching Hospital Services Behav. Health & Sub Abuse Income Physical Therapy Heat Literacy Faith Community
Its About the Basics (the hard work!) Advanced Primary Care/PCMH (New workforce: Practice RN Care Managers) Bundled Payments Amb Community Care Teams for High-Cost/High-Risk Patients (New workforce: CCT staff) Partial Capitation Comm Enhanced Care Transitions (New workforce: Hospital + Community- based Care Transition Coaches) Global Capitation Comm Healthcare Delivery System Change System Transformation Payment Reform
CMS ACO Metrics Better Health for Individuals CAHPS: 7 items All cause readmission rate Ambulatory sensitive conditions for COPD and CHF % PCPs qualifying for EMR incentive Medication Reconciliation after hosp. Screening for fall risk 26
CMS ACO Better Health for Populations Preventive Health: 8 metrics including depression screen Diabetes composite: 6 metrics Hypertension Heart Disease: 5 metrics 27
CMS ACO CAHPS 53. In the last 6 months, how often was it easy to get the care, tests or treatment you thought you needed? 57. In the last 6 months, did anyone on your health care team ask you if there was a period of time when you felt sad, empty, or depressed?
58. In the last 6 months, did you and anyone on your health care team talk about things in your life that worry you or cause you stress? 65. During the last 4 weeks, how much did your physical health interfere with your normal social activities with family, friends, neighbors or groups?
Promis 31
Head and Heart Money Recognition Right Thing