Patterns and Profiles of Return Migration in Argentina, Romania, Senegal, and Ukraine
Explore the dynamics of return migration and circular migration within four origin countries as researched by Inmaculada Serrano. Learn about the motivations behind increasing policy attention towards return migration and the findings from the TEMPER Origin Surveys. Understand the definitions of returned migrants and circular migrants as outlined in the study.
Download Presentation

Please find below an Image/Link to download the presentation.
The content on the website is provided AS IS for your information and personal use only. It may not be sold, licensed, or shared on other websites without obtaining consent from the author. If you encounter any issues during the download, it is possible that the publisher has removed the file from their server.
You are allowed to download the files provided on this website for personal or commercial use, subject to the condition that they are used lawfully. All files are the property of their respective owners.
The content on the website is provided AS IS for your information and personal use only. It may not be sold, licensed, or shared on other websites without obtaining consent from the author.
E N D
Presentation Transcript
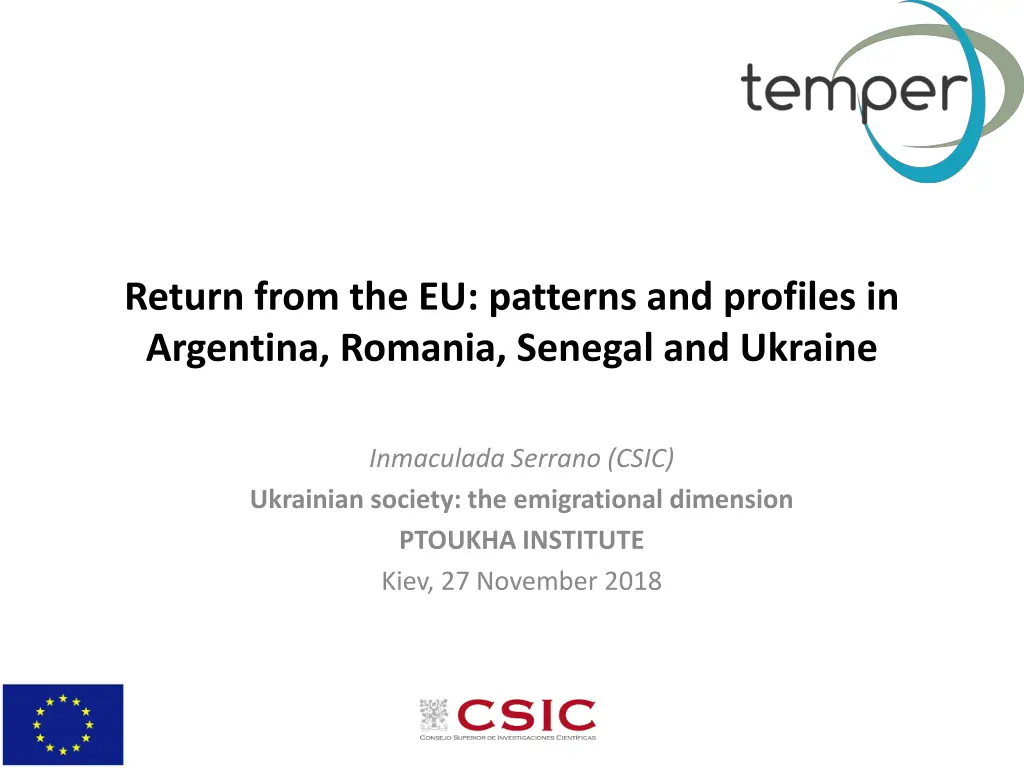
Return from the EU: patterns and profiles in Argentina, Romania, Senegal and Ukraine Inmaculada Serrano (CSIC) Ukrainian society: the emigrational dimension PTOUKHA INSTITUTE Kiev, 27 November 2018
INTRODUCTION TEMPER KickOff Meeting
Motivation Increasing policy attention to return, and circulation as a potential new way of managing migration (EU perspective: e.g. GAMM 2015) Still limited and fragmented knowledge on return migration and circular migration
The TEMPER Origin Surveys TEMPER (Temporary vs. Permanent Migration) EU FP7 funded (2014-2018) Coordinated by the CSIC in Spain 9 Work Packages (high-skilled, seasonal, etc.) 2 WP on the determinants and impacts of return & circular migration Comparative surveys conducted in 4 origin countries: Argentina, Romania, Senegal and Ukraine
Return migrants (aprox. 250 per flow) Non-migrants (aprox. 250 per flow) Temporary return / repeated or circular migration Permanent return TEMPER KickOff Meeting
% Returnees over total population AR RO SN UA All RETs 0.2% 0.5% 0.56% 1.32% (labour migrants) <Aza<<z Specific destinations ES: no more than 1/4 ES: 0.05% DE: 0.015% ES: 0.02% FR: 0.05% PL: 0.48% IT: 0.11% (USA, Italy, Latinamerica) Source Census 2010 Census 2011 Census 2013 LMS 2017
Definitions RETURNED MIGRANT persons who moved from one of our EU destinations (after staying there for at least 3 [2 UA] months) back to his/her country of birth (and stayed there at least 3 months) regardless of the reasons for migration and return [UA work or study during stay] (last migration: min. 1996) (last return: min. 2000) 3-MONTH limit: to ensure we capture circular migrants
Definitions CIRCULAR MIGRANT (strict definition) sequence of migration between two main countries within a year that is repeated in at least two consecutive loops: UA-IT-UA-IT CIRCULAR MIGRANT (wide definition) three or more returns to the country of birth after staying in any EU country in a period of 10 years: UA-IT-UA-PL-UA-IT-UA (In line with UNECE 2016 definitions)
Caveats Returnees selected out of the migrant population (cannot say anything about migrants, or about this selection/drivers to return) expost merging with datasets in destination Migrants Cannot say anything about: -Relative size -Common or distinct? E.g. time of arrival, reason for migration, etc. Returnees
Caveats Circular migrants mobile by definition, they could be at origin or destination at the time of the interview we don t expect large differences between the two sub-populations Migrants AR July 2017- Aug 2018 RO Nov 2017- Mar 2018; May-Aug 2018 SN Oct 2017-Jan 2018; Apr-May 2018 UA Oct 2017-Feb 2018; Mar-Jul 2018 Circular migrants at destination Circular migrants at origin
RESULTS TEMPER KickOff Meeting
High incidence of short-term migration among returnees Total 48% UA-PL 84% UA-IT 47% SN-FR 38% SN-ES 36% RO-DE 36% RO-ES 62% AR-ES 24% 0% 10% 20% 30% 40% 50% 60% 70% 80% 90% Unexpected finding: almost half of the total sample of returnees are short- term migrants (<3 months) significant in all flows Implications: significant part of international mobility overlooked in most migration studies (standard definition of migrants as changes of residence / min. 1 year)
Short-term migration (among returnees): migrant profiles Sex, age, education: no significant differences Reasons for migration: no significant differences AR-ES: + study, - family SN-FR: - study, + economic Reasons for migration (short-term) 100% 80% Other 60% Lifestyle Study 40% Financial 20% Family 0% AR-ES RO-ES RO-DE SN-ES SN-FR UA-IT UA-PL Total Preliminary conclusion: similar migrants Different migration projects Different results/endings of migration experience
Short-term migration (among returnees): reasons of return Reasons for return: less weight of family + studies AR-ES + economic RO, UA + administrative SN-ES, UA Voluntariness of return: no significant differences RO-ES: + voluntary SN-ES: - voluntary Voluntariness of returns (short-term) Reasons for return (short-term) 100% Other 80% 17% 14% Lifestyle 41% 36% 36% 60% Emotional 47% 20% 19% Administr 40% Study 20% Financial 0% Family AR-ES RO-ES RO-DE SN-ES SN-FR UA-IT UA-PL Reasons for return (long-term) 100% 100% Other 21% 11% 80% 90% 7% Lifestyle 13% 12% 80% 15% 60% Emotional 70% Administr 60% 40% Mixture Study 50% Non-voluntary 20% 40% Financial Voluntary 30% 0% Family 20% AR-ES RO-ES RO-DE SN-ES SN-FR UA-IT UA-PL 10% 0% AR-ES RO-ES RO-DE SN-ES SN-FR UA-IT UA-PL
Short-term migration (among returnees): circularity Short-term migrants more likely to be circular. Although no large differences: except SN (highest levels of circularity) % CIRCULAR MIGRANTS (wide def) in long-term and short-term flows 3% UA-PL 8% 2% UA-IT 4% 10% SN-FR 27% long-term 13% SN-ES 31% short-term 0% RO-DE 3% 2% RO-ES 4% 1% AR-ES 7%
Short-term migration (among returnees): circularity Short-term migrants ALSO more likely to remigrate soon. Large differences, except AR, UA-IT , UA-PL(-) ALSO more likely to intend short-term remigration (UA-PL -) % Likely to remigrate in 2 years in long-term and short-term flows 56% 59% UA-PL 47% 46% UA-IT 36% SN-FR 63% long-term 39% SN-ES BUT less likely to remigrate to same destination 71% short-term 31% RO-DE 45% 38% RO-ES 50% 34% AR-ES 39% % Intends remigration to LAST DESTINATION in long-term and short-term flows % Intends short-term remigration in long-term and short-term flows 76% 73% UA-PL UA-PL 59% 69% 70% 40% UA-IT UA-IT 42% 61% 66% 66% 36% SN-FR SN-FR 46% 44% long-term long-term 62% SN-ES SN-ES 65% 63% 51% short-term short-term 31% RO-DE RO-DE 43% 63% 73% 27% RO-ES RO-ES 51% 46% 65% 18% AR-ES AR-ES 39% 30%
Circularity: incidence Circular migrants (wide def.) Total 7% UA-PL 8% UA-IT 3% SN-FR 16% SN-ES 19% Complex migrants (+1 migration) RO-DE 1% Total 20% RO-ES 3% AR-ES 2% UA-PL 15% 30% UA-IT 7% 0% 10% 20% 40% 50% SN-FR 46% SN-ES 40% RO-DE 2% RO-ES 16% 1-migration cycles dominant in all returnee flows (exception SN) also UA-PL! AR-ES 16% 0% 10% 20% 30% 40% 50%
Circularity: a matter of short stays? 68% of all circular migrants had short stays abroad (what we miss when long-term migration considered only) Even higher percentages per flow: RO-DE, UA-PL > 90% Share of circular migrants (over total in each flow) short-term long-term 93% UA-PL 7% 64% UA-IT 36% 63% SN-FR 38% 58% SN-ES 42% 100% RO-DE 0% 78% RO-ES 22% 80% AR-ES 20%
Return migrants: satisfaction Large levels of satisfaction with life: above 70%, except UA Also with return decision, although lower levels (UA in middle levels, PL>IT) Satisfaction with life Satisfaction with return decision 100% 100% 3% 6%10% 11% 25%14% 14%6% 6% 19%12%7% 8% 9% 80% 80% 60% 60% Disatisfied Disatisfied 82%77%89%82%89% 79%82% 40% 40% 78%70%76% Neither Neither 70% 70% 63% 63% Satisfied Satisfied 20% 20% 0% 0%
Return migrants: change of plans Significant proportions change their initial plans: at the moment of return they expected to remigrate, but at the time of the interview they consider unlikely to remigrate In AR also 9% expected to remigrate but thought it unlikely at the time of interview Change of plans: likely to remigrate or not 100% 90% 18% 18% 80% 14% Unclear expectations 12% 21% 22% 70% 20% 9% 60% Unlikely to remigrate against expectations 50% Likely to remigrate against expectation 40% 71% 69% 68% 62% 30% 60% 57% 54% Plans unchanged 20% 10% 0% AR-ES RO-ES RO-DE SN-ES SN-FR UA-IT UA-PL
Return migrants: financial situation Capacity to cover household s basic needs: most returnees had sufficient resources at the time of return and still have sufficient at the time of the interview, except in UA Financial situation at return Financial situation at interview Sufficien Insuffici Sufficien Insuffici 100% 100% 80% 80% 60% 60% 90% 87% 82% 40% 81% 81% 85% 85% 40% 78% 68% 59% 50% 48% 20% 45% 20% 39% 0% 0% AR-ES RO-ES RO-DE SN-ES SN-FR UA-IT UA-PL AR-ES RO-ES RO-DE SN-ES SN-FR UA-IT UA-PL
Return migrants: activity Most returnees were working before their return (almost all in UA) Much higher levels of inactivity and unemployment at the time of interview: particularly high in UA and RO-DE Activity status at interview Activity status at return 100% 100% 8% 26% 23% 19% 18%34%26% 4% 80% 3% 7% 80% 8% 18% 9% 8% 60% 60% Other Other 99% 99% 76%91% 95% 40% 40% 77% 77% Unemp Unemp 20% 20% Working Working 0% 0%
Return migrants: type of jobs Most returnees worked in formal economy before returning, except for UA The level of formality increases further at origin, except for SN-ES Formal contract at return Formal contract at interview 100% 100% 4% 9% 8% 4% 8%13% 17%21%24%12% 14% 80% 80% 10% 68%53% 60% 60% No No 40% 40% Not alwasy Not alwasy 20% 20% Yes Yes 0% 0%
Return migrants: subjective impact Returnees with minor children overwhelming think return had a positive impact on children Most think return had a positive impact on the capacity to cover care needs, educational needs and healthcare needs (except AR) Impact of return on children's emotional wellbeing Impact of return on capacity to cover healthcare needs 100% 100% 6% 80% 80% 7% 60% 60% No effect No effect 39% 36%43%50% 51% 49% 81% 78% 40% 40% 73%63%73% Negative Negative 24% 56% Positive Positive 20% 20% 25% 0% 0%
Return migrants: comparing origin and destination (EU) The majority of returnees considered that success in destination (EU) is a matter of work, whereas at origin it s a matter of luck and connections Significant proportions still consider luck and connections matter more also in destination: highest for SN Reward to effort at destination (EU) Reward to effort at origin Success related to work Success related to work Success unrelated to work (luck, connections) Success unrelated to work (luck, connections) 100% 100% 80% 80% 60% 60% 84% 40% 40% 77% 77% 76% 76% 76% 62% 54% 48% 20% 20% 40% 37% 31% 27% 25% 0% 0% AR-ES RO-ES RO-DE SN-ES SN-FR UA-IT UA-PL AR-ES RO-ES RO-DE SN-ES SN-FR UA-IT UA-PL
Return migrants: where is home? Significant proportions of returnees in all flows felt at home in the country of destination: lowest levels in UA, highest in AR-ES The immense majority feel at home in the country of origin: lowest levels in AR Felt at home at destination Feels at home at origin 100% 100% 14% 80% 80% 60% 60% Disagree 40% 79% 86%98% 98% 98% 96% 97% 98% Disagree 40% 37%50%35%44%28%23% Agree 20% Agree 20% 0% 0%
Thank you for your attention! inmaculada.serrano@cchs.csic.es http://temperproject.eu/ TEMPER KickOff Meeting


