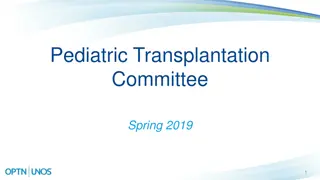
Pediatric Heart-Lung Transplantation Insights 2018: Recipient and Donor Statistics
Explore the characteristics and outcomes of pediatric heart-lung transplant recipients in 2018. Discover age distribution, donor statistics, retransplants, and more. Visual data included.

Download Presentation

Please find below an Image/Link to download the presentation.
The content on the website is provided AS IS for your information and personal use only. It may not be sold, licensed, or shared on other websites without obtaining consent from the author. If you encounter any issues during the download, it is possible that the publisher has removed the file from their server.
You are allowed to download the files provided on this website for personal or commercial use, subject to the condition that they are used lawfully. All files are the property of their respective owners.
The content on the website is provided AS IS for your information and personal use only. It may not be sold, licensed, or shared on other websites without obtaining consent from the author.
E N D
Presentation Transcript
HEART-LUNG TRANSPLANTATION Pediatric Recipients 2018 JHLT. 2018 Oct; 37(10): 1155-1206
Table of Contents Donor, recipient and center characteristics: slides 3-15 Post-transplant survival and other outcomes: slides 16-24 2018 JHLT. 2018 Oct; 37(10): 1155-1206
Donor, Recipient and Center Characteristics 2018 JHLT. 2018 Oct; 37(10): 1155-1206
Pediatric Heart-Lung Transplants Recipient Age Distribution (Transplants: January 1985 June 2017) 500 465 450 400 Number of Transplants 350 300 250 200 136 150 113 100 50 19 0 <1 1-5 Recipient Age (Years) 6-10 11-17 2018 JHLT. 2018 Oct; 37(10): 1155-1206
Pediatric Heart-Lung Transplants Donor Age Distribution (Transplants: January 1985 June 2017) 400 352 350 Number of Transplants 300 250 200 169 150 100 70 44 50 11 1 0 0-10 11-17 18-34 Donor Age (Years) 35-49 50-59 60+ 2018 JHLT. 2018 Oct; 37(10): 1155-1206
Pediatric Heart-Lung Transplants Age Distribution by Year 65 60 11-17 6-10 1-5 <1 55 50 Number of Transplants 45 40 35 30 25 20 15 10 5 0 NOTE: This figure includes only the heart-lung transplants that are reported to the ISHLT Transplant Registry. As such, this should not be construed as evidence that the number of pediatric heart-lung transplants worldwide has declined in recent years. 2018 JHLT. 2018 Oct; 37(10): 1155-1206
Pediatric Heart-Lung Retransplants by Year of Retransplant 6 18 Pediatric Heart-Lung Transplants N % % of Retransplants out of All 5 15 Number of Retransplants 4 12 3 9 2 6 1 3 0 0 Year of Retransplant 2018 Only patients who were less than 18 years old at the time of retransplant are included. JHLT. 2018 Oct; 37(10): 1155-1206
Pediatric Heart-Lung Retransplants (Retransplants: January 1985 June 2017) 10 9 Number of Retransplants 8 7 6 5 4 3 2 1 0 0-<1 month 1-<12 months 12-<36 months 36+ months Time Between Previous and Current Transplant 2018 Analysis includes deceased and living donor transplants. JHLT. 2018 Oct; 37(10): 1155-1206
Pediatric Heart-Lung Transplants Age Distribution by Era of Transplant <1 1-5 6-10 11-17 100% 90% 80% % of Transplants 70% 60% 50% 40% 30% 20% 10% 0% 1985-1999 (N=527) 2000-2007 (N=127) 2008-6/2017 (N=79) 2018 JHLT. 2015 Oct; 34(10): 1255-1263 JHLT. 2018 Oct; 37(10): 1155-1206
Pediatric Heart-Lung Transplants Number of Centers Reporting Transplants by Location (Transplants: January 1984 December 2016) 30 No. of Pediatric Transplant Centers Other 25 North America Europe 20 15 10 5 0 Transplant Year 2018 JHLT. 2018 Oct; 37(10): 1155-1206
Pediatric Heart-Lung Transplants Number of Centers Reporting Transplants by Center Volume 30 No. of Pediatric Transplant Centers 1-4/yr 5-9/yr 25 10-19/yr 20-29/yr 20 15 10 5 0 Transplant Year 2018 JHLT. 2018 Oct; 37(10): 1155-1206
Pediatric Heart-Lung Transplants Diagnosis Distribution (Transplants: January 1986 December 2016) 34% CF IIP ILD-not IIP IPAH OB PH-not IPAH Retransplant Other Other includes A1ATD, Non CF-bronchiectasis, and LAM/tuberous sclerosis 3% 3% 1% 28% 27% 2% 1% 100 % of Cases CF IPAH PH-not IPAH 75 50 25 0 NOTE: Unknown diagnoses were excluded from this tabulation. 2018 JHLT. 2018 Oct; 37(10): 1155-1206
Pediatric Heart-Lung Transplants Age Distribution by Location (Transplants: January 2000 June 2017) <1 1-5 6-10 11-17 100% 80% % of Transplants 60% 40% 20% 0% Europe North America Other 2018 JHLT. 2018 Oct; 37(10): 1155-1206
Pediatric Heart-Lung Transplants Diagnosis Distribution by Location (Transplants: January 2000 June 2017) CF IPAH PH-not IPAH Other 100% 80% % of Transplants 60% 40% 20% 0% Europe (N=79) North America (N=63) Other (N=19) 2018 JHLT. 2018 Oct; 37(10): 1155-1206
Pediatric Heart-Lung Transplants Donor Age Distribution by Location (Transplants: January 2000 June 2017) 0-10 11-17 18-34 35-49 50-59 60+ 100% 80% % of Donors 60% 40% 20% 0% Europe North America Other 2018 JHLT. 2014 Oct; 33(10): 1025-1033 JHLT. 2015 Oct; 34(10): 1255-1263 JHLT. 2018 Oct; 37(10): 1155-1206
Post-Transplant: Survival and Other Outcomes 2018 JHLT. 2018 Oct; 37(10): 1155-1206
Pediatric Heart-Lung Transplants Kaplan-Meier Survival by Major Diagnosis (Transplants: January 1990 June 2016) 100 CF (N=138) IPAH (N=131) PH-not IPAH (N=153) 75 Survival (%) Median survival (years): CF=3.8; IPAH=4.8; PH-not IPAH=2.7 50 25 No pair-wise comparisons were significant at p<0.05. 0 0 1 2 3 4 5 6 7 Years 8 9 10 11 12 13 14 15 2018 JHLT. 2018 Oct; 37(10): 1155-1206
Pediatric Heart-Lung Transplants Kaplan-Meier Survival Conditional on Survival to 1 Year by (Transplants: January 1990 June 2016) Major Diagnosis 100 CF (N=98) PH-not IPAH (N=94) IPAH (N=100) 75 Median survival (years): CF=6.5; IPAH=7.7; PH-not IPAH=7.6 Survival (%) 50 25 No pair-wise comparisons were significant at p<0.05. 0 0 1 2 3 4 5 6 7 Years 8 9 10 11 12 13 14 15 2018 JHLT. 2018 Oct; 37(10): 1155-1206
Pediatric Heart-Lung Transplants Kaplan-Meier Survival by Age Group (Transplants: January 1985 June 2016) 100 <1 (N = 19) 1-5 (N = 111) 75 6-10 (N = 135) No pair-wise comparisons were significant at p<0.05 except all comparisons with <1. 11-17 (N = 461) Survival (%) 50 25 Median survival (years): <1=NA; 1-5=1.6; 6-10=3.5; 11-17=3.3 0 0 1 2 3 4 5 6 7 8 9 10 11 12 13 14 15 16 17 18 19 20 Years 2018 JHLT. 2018 Oct; 37(10): 1155-1206
Pediatric Heart-Lung Transplants Kaplan-Meier Survival Conditional on Survival to 1 Year by (Transplants: January 1985 June 2016) Age Group 100 No pair-wise comparisons were significant at p<0.05. 1-5 (N = 64) 6-10 (N = 94) 75 11-17 (N = 305) Survival (%) 50 25 Median survival (years): 1-5=8.0; 6-10=7.4; 11-17=8.2 0 0 1 2 3 4 5 6 7 8 9 10 11 12 13 14 15 16 17 18 19 20 Years 2018 JHLT. 2018 Oct; 37(10): 1155-1206
Pediatric Heart-Lung Transplants Kaplan-Meier Survival by Era (Transplants: January 1985 June 2016) 100 1985-1989 (N=180) 1990-1999 (N=346) 2000-2005 (N=94) 2006-6/2016 (N=106) 75 No pair-wise comparisons were significant at p<0.05. Survival (%) 50 25 Median survival (years): 1985-1989=1.7; 1990-1999=3.0; 2000-2005=4.6; 2006-6/2016=4.3 0 0 1 2 3 4 5 6 7 8 9 10 11 12 13 14 15 16 17 18 19 20 21 22 23 Years 2018 JHLT. 2018 Oct; 37(10): 1155-1206
Pediatric Heart-Lung Transplants Kaplan-Meier Survival Conditional on Survival to 1 Year by Era (Transplants: January 1985 June 2016) 100 1985-1989 (N=98) 1990-1999 (N=227) 2000-2005 (N=62) 2006-6/2016 (N=80) 75 No pair-wise comparisons were significant at p<0.05. Survival (%) 50 25 Median survival (years): 1985-1989=10.1; 1990-1999=6.3; 2000-2005=11.2; 2006-6/2016=NA 0 0 1 2 3 4 5 6 7 8 9 10 11 12 13 14 15 16 17 18 19 20 Years 2018 JHLT. 2018 Oct; 37(10): 1155-1206
Pediatric Heart-Lung Transplants Cause of Death (Deaths: January 2000 June 2017) 0-30 Days (N = 28) 31 Days - 1 Year (N = 19) >1 Year - 3 Years (N = 31) >3 Years - 5 Years (N = 14) >5 Years (N = 62) CAUSE OF DEATH OB/BOS 0 1 (5.3%) 12 (38.7%) 5 (35.7%) 12 (19.4%) Acute rejection 2 (7.1%) 0 0 1 (7.1%) 1 (1.6%) Lymphoma 0 1 (5.3%) 0 0 1 (1.6%) Malignancy, other 0 1 (5.3%) 1 (3.2%) 0 2 (3.2%) Infection, non-CMV 3 (10.7%) 4 (21.1%) 2 (6.5%) 2 (14.3%) 10 (16.1%) Graft failure 7 (25.0%) 2 (10.5%) 11 (35.5%) 3 (21.4%) 15 (24.2%) Cardiovascular 2 (7.1%) 1 (5.3%) 2 (6.5%) 1 (7.1%) 9 (14.5%) Technical 6 (21.4%) 0 0 1 (7.1%) 0 Multiple organ failure 4 (14.3%) 2 (10.5%) 1 (3.2%) 0 7 (11.3%) Other 4 (14.3%) 7 (36.8%) 2 (6.5%) 1 (7.1%) 5 (8.1%) 2018 JHLT. 2018 Oct; 37(10): 1155-1206
Pediatric Heart-Lung Transplants Relative Incidence of Leading Causes of Death (Deaths: January 2000 June 2017) 60 OB/BOS Infection (Non-CMV) Graft Failure Cardiovascular 50 40 % of Deaths 30 20 10 0 0-30 Days (N = 28) 31 Days - 1 Year (N = 19) >1 Year - 3 Years (N = 31) >3 Years - 5 Years (N = 14) >5 Years (N = 62) 2018 JHLT. 2018 Oct; 37(10): 1155-1206