Peralta Community College District Adopted Budget 2019 Overview
The adopted budget for Peralta Community College District for the year ending June 30th, 2019 includes major budget assumptions, revenue assumptions, and expenditure assumptions. It outlines the financial projections, fund balances, revenue sources, and planned expenditures for the district.
Download Presentation

Please find below an Image/Link to download the presentation.
The content on the website is provided AS IS for your information and personal use only. It may not be sold, licensed, or shared on other websites without obtaining consent from the author.If you encounter any issues during the download, it is possible that the publisher has removed the file from their server.
You are allowed to download the files provided on this website for personal or commercial use, subject to the condition that they are used lawfully. All files are the property of their respective owners.
The content on the website is provided AS IS for your information and personal use only. It may not be sold, licensed, or shared on other websites without obtaining consent from the author.
E N D
Presentation Transcript
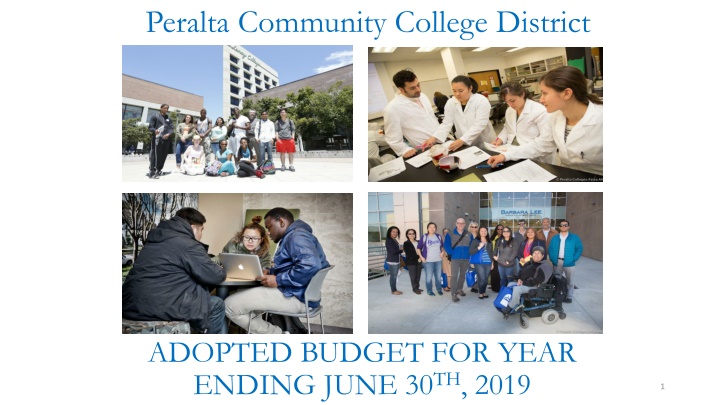
Peralta Community College District ADOPTED BUDGET FOR YEAR ENDING JUNE 30TH, 2019 1
I. Major Budget Assumptions General Assumptions 1. The FY 2018-19 General Fund Unrestricted Beginning Fund Balance is projected at approximately $15.8 million representing an adequate reserve level of 10.90%. 2. The FY 2018-19 Adopted Budget reflects a balanced budget as a result of the freezing of $4,500,000 in Vacant Positions. 3. The FY 2018-19 Final Adopted Budget will have a Reserve (Ending Balance) of no less than 5%. 4. The District and Colleges will use plans, planning documents, and planning processes as a basis for the development of their expenditure budgets. 5. Recommendations from the BAM Task Force with respect to resource allocation will be implemented during the budget development process. 6. The District does not intend to issue a Tax Revenue Anticipation Note (TRANs) in FY 2018-19 7. All State Apportionment deferrals have been eliminated. 8. There will be a line item in the budget for facilities maintenance and repair. Revenue Assumptions 1. ENROLLMENT: Full Time Equivalent Students (FTES) target of 18,723 generated (Resident, for-credit) Funded base 18,623 credit FTES Funded base 100 non-credit FTES Enrollment growth funds of $57.8 Million system wide to fund 1.00% growth (average) 0% growth budgeted for PCCD in 2018-19 2. 3. Statutory Cost of Living Adjustment (COLA) of 2.71% at $161.2 Million for FY2018-19 (used to fund step/column salary increases). Approximately $413,265 for PCCD 4. Supplemental Allocation Student Equity $ 22.2 Million 5. Student Success Allocation $ 11.6 Million 6. Unrestricted lottery at $151 per FTES $2.8 Million for PCCD 7. Scheduled Maintenance & Instructional Equipment allocation $143.5 Million state-wide PCCD allocation of $464,037, no match required Sixth Year of Parcel Tax- Measure B estimated to be $8,000,000 SSSP, Student Equity, Adult Education and Strong Workforce funding at 2016-17 levels Expenditure Assumptions 8. 9. 1. Step and column salary increases are included (funded with 2.71% COLA allocation of $413,265), PCCD costs approximately $1.4M 2. Public Employee Retirement System employer contribution increase from 15.53% to 17.10%, an increase estimated at $245,000 to PCCD 3. State Teachers Retirement System employer contribution increased from 14.43 to 16.28%, an increase estimated at $476,000 to PCCD. 4. Maintain District contribution to DSPS program of approximately $1.2 Million 5. OPEB Debt Service Payment of approximately $4.3 Million due to bond program restructuring 6. Continued implementation of the new OPEB long term funding plan impacting Fund 01, Fund 69 and the OPEB Trust Fund 7. Contribute to the new Irrevocable Trust in the amount of $250,000 as per OPEB long term funding plan 8. Contribute $400,000 to Self-Insurance Fund to cover costs of Property and Liability Insurance 9. Any restricted funding cuts or cost increases must be borne by the respective program 10. Medical premiums $15.3 Million 11. Utilities to be budgeted at the campus level are based on prior year actuals with a 5% increase at approximately $555,000 12. Healthcare increase of $338,000 2
Full Time Equivalent Students (FTES) 2014-15 2015-16 Fiscal Year Target Credit FTES Non Credit FTES Credit FTES Stability Non Credit FTES Stability Credit FTES Restoration Non Credit FTES Restoration Adjusted Base 2016-17 Stability 19,528 2017-18 19,528 15,768 55 2018-19 Hold Harmless 18,623 100 18,524 41 19,472 30 (63) 89 (3,785) 25 948 (11) 19,502 2,900 19,528 15,768 18,723 18,723 FY 2017-18 Attendance Report - Period 2 Summer 2017 Fall 2017 Spring 2018 Summer 2018 (Projections) + Non-Credit Total FTES Full-Time Equivalent Students 1,746.94 7,763.57 7,204.99 1,910.22 99.48 18,723 Change in FY17-18 Allocation Base Allocation 17-18 - Adjusted Base for FY17-18 Shortfall FTES X Funding Rate Credit Funding Shortfall 19,528 18,723 (805) $ 5,072.11 3 ($4,083,049)
25,000 Restoration 19,502 19,528 Hold Harmless Hold Harmless Stability 19,528 20,000 18,723 18,723 17,515 FTES (Full-Time Equivalent Students) 18,723 ? 16,976 15,000 15,768 Actual FTES Reported FTES 10,000 5,000 0 2014-15 2015-16 2016-17 2017-18 2018-19 2019-20 Fiscal Year Fiscal Year 2014-15 2015-16 2016-17 2017-18 2018-19 2019-20 Reported FTES 19,502 19,528 15,768* 19,528 18,723 18,723 Actual FTES 19,502 19,528 17,515* 18,723** 16,976 ? *Actual FTES includes Summer 2017 of 1,747 FTES, and the Reported FTES excludes Summer 2017 **Actual FTES includes borrowing of Summer 2017 of 1,747 FTES 4
Student Centered Funding Formula (SCFF) State apportionments is calculated using three allocations: FY2018-19 FY2019-20** FY2020-21** 1Base Allocation* Dollars per Credit FTES 2Supplemental Allocation- Dollars per Point 3Student Success Allocation-Dollars per Point $ 3,727 $ 3,387 $ 3,046 $ 919 $ 919 $ 919 $ 111 $ 111 $ 111 *Base Allocation is calculate based on the numbers of colleges and comprehensive center consistent with the current formula. **The amount of the allocations in outgoing fiscal years will be adjusted by the changes in the cost-of-living in those years. Noncredit FTES will be funded at current rates. The SSFF rates are calculated to provide a three-year transition at the following percentage: FY2018-19 1Base Allocation 70% 2Supplemental 20% 3Student Success FY2019-20 FY2020-21 65% 20% 15% 60% 20% 20% 10% 5
Proposed Budget Vacancy Freeze for General Fund $4,475,853 Vacancy Freeze by Location Locations Accepted Savings ($) COA 403,997 Laney 1,487,225 Merritt 755,586 BCC 665,661 District 1,163,384 Totals $4,475,853 Total Position Benefits Vacancies Savings Salaries (15) $ (1,089,356) $ (625,123) $ (1,714,479) - - (5) (447,952) (16) (1,268,325) (36) $ (2,805,633) $ (1,670,220) $ (4,475,853) Positions in FY 2019 Proposed Budget Salaries Benefits 317 $ 25,151,587 $ 11,362,357 $ 36,513,944 37 5,424,834 2,068,040 68 4,236,677 2,294,278 366 27,148,880 25,465,697 788 $ 61,961,978 $ 41,190,372 $ 103,152,350 Category (FTE) Full-time Academic Academic Administrator Other Faculty Classified Totals (1-18) FTE Salaries Total FTE Benefits Total FTE Total 332 $ 26,240,943 $ 11,987,480 $ 38,228,423 37 5,424,834 2,068,040 73 4,684,629 2,551,417 382 28,417,205 26,253,655 824 $ 64,767,611 $ 42,860,592 $ 107,628,203 7,492,874 7,236,046 54,670,860 - - 7,492,874 6,530,955 52,614,577 (257,139) (787,958) (705,091) (2,056,283) Part-Time Totals (Part-Time and Subs 243 243 $ 11,677,624 $ 748,096 $ 12,425,720 11,677,624 748,096 12,425,720 - - $ - $ - $ - - - - 243 243 $ 11,677,624 $ 748,096 $ 12,425,720 11,677,624 748,096 12,425,720 GRAND TOTAL 1,067 $76,445,235 $ 43,608,688 $ 120,053,923 (36) $ (2,805,633) $ (1,670,220) $ (4,475,853) 1,031 $ 73,639,602 $ 41,938,468 $ 115,578,070 6
PCCD FY 18-19 Adopted Budget w/Reductions Actual 16,976 FTES FY18-19 Budget w/Meas. B Expenses Included Subtract Measure B Expenses FY18-19 Final Budget Revenue Federal Revenue State Revenue Local Revenue Trans Res Revenue $ - $ - $ - 58,711,416 70,787,368 9,650,000 $ 139,148,784 58,711,416 70,787,368 9,650,000 - - - Revenue Total $ 139,148,784 $ - Expenses Full Time Academic Academic Admin Other Faculty Part Time Academic Classified Salary Fringe Benefits Bad Debts DGS Books, Supplies, Svcs Equipment Cap Outlay Other Outgo 25,151,587 5,424,834 5,138,978 14,942,111 29,214,688 43,839,191 1,050,000 - - 25,151,587 5,424,834 4,236,677 11,677,623 27,276,438 41,944,230 1,050,000 902,301 3,264,488 1,938,250 1,894,961 - - - - - - - 19,121,578 274,071 6,309,000 19,121,578 274,071 6,309,000 Total Expenditures $ 150,466,038 $ 8,000,000 $ 142,466,038 Beginning Fund Balance Net Increase(Decrease) Ending Fund Balance Ending Fund Balance % $ 15,830,544 $ - $ 15,830,544 (3,317,254) $ 12,513,290 (11,317,254) 8,000,000 $ 4,513,290 $ - 3.00% 0.00% 8.78%
PCCD FY 18-19 Adopted Budget w/Reductions Hold Harmless 18,723 FTES FY18-19 Budget w/Meas. B Expenses Included Subtract Measure B Expenses FY18-19 Final Budget Revenue Federal Revenue State Revenue Local Revenue Trans Res Revenue $ - $ - $ - 65,486,282 70,787,368 9,650,000 $ 145,923,650 65,486,282 70,787,368 9,650,000 - - - Revenue Total $ 145,923,650 $ - Expenses Full Time Academic Academic Admin Other Faculty Part Time Academic Classified Salary Fringe Benefits Bad Debts DGS Books, Supplies, Svcs Equipment Cap Outlay Other Outgo 25,151,587 5,424,834 5,138,978 14,942,111 29,214,688 43,839,191 1,050,000 - - 25,151,587 5,424,834 4,236,677 11,677,623 27,276,438 41,944,230 1,050,000 902,301 3,264,488 1,938,250 1,894,961 - - - - - - - 19,121,578 274,071 6,309,000 19,121,578 274,071 6,309,000 Total Expenditures $ 150,466,038 $ 8,000,000 $ 142,466,038 Beginning Fund Balance Net Increase(Decrease) Ending Fund Balance Ending Fund Balance % $ 15,830,544 $ - $ 15,830,544 (4,542,388) 8,000,000 3,457,612 $ 11,288,156 $ - $ 19,288,156 7.50% 0.00% 13.54%
Recommended Next Steps District must define what is a healthy fund balance? To support Mission & Vision of District To support unforeseen spending in the area of operating and capital expenditures To support cash flow of District Short/Long Strategic Plan must be in place to address : Impact of New Funding Formula Reorganization/Restructuring (Centralized/Decentralized) Enrollment Projections (Is District growing, declining, or stabilizing?) Possible additional Revenue streams Possible Budget Realignment/Reductions Facilities Plan Energy Management Plan Continual Fostering of an Collaborative /Participatory Environment with all our constituents 9
Any Budget Questions? 10
