Performance Dashboard Overview January 8, 2025
Discover the Usability Performance Dashboard (UPD) designed to provide quick access to data for enhancing user experience and making informed decisions. Learn about the key metrics, adoption into daily processes, and data sources integrated within the dashboard.

Download Presentation

Please find below an Image/Link to download the presentation.
The content on the website is provided AS IS for your information and personal use only. It may not be sold, licensed, or shared on other websites without obtaining consent from the author. If you encounter any issues during the download, it is possible that the publisher has removed the file from their server.
You are allowed to download the files provided on this website for personal or commercial use, subject to the condition that they are used lawfully. All files are the property of their respective owners.
The content on the website is provided AS IS for your information and personal use only. It may not be sold, licensed, or shared on other websites without obtaining consent from the author.
E N D
Presentation Transcript
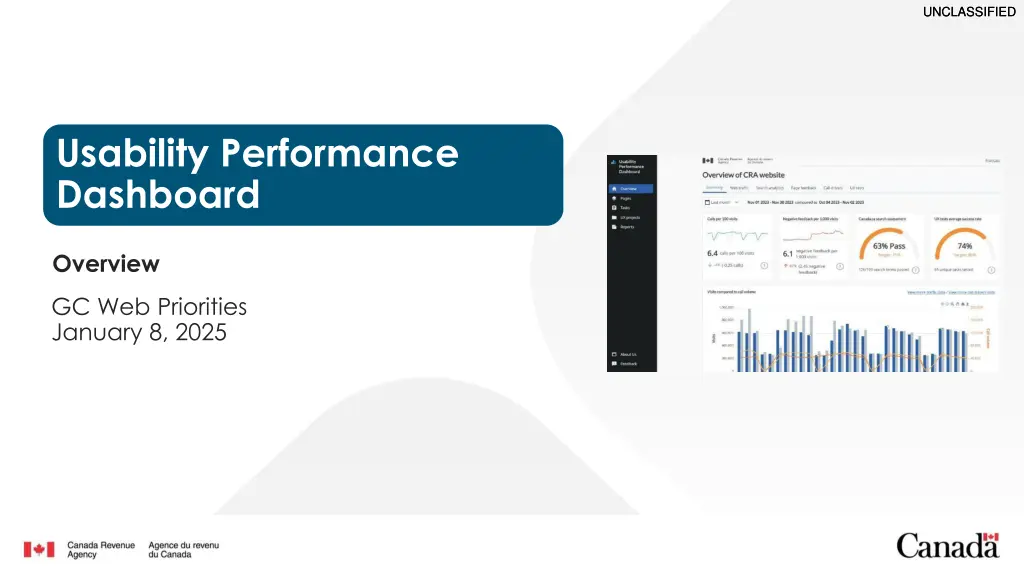
UNCLASSIFIED UNCLASSIFIED Usability Performance Dashboard Overview GC Web Priorities January 8, 2025
UNCLASSIFIED - NON CLASSIFI Agenda What is the UPD and who is it for? Business Value Adoption Data Sources Task Management UPD Demo Case Studies Future of UPD 5763 2
UNCLASSIFIED - NON CLASSIFI "Data will talk to you if you re willing to listen." Jim Bergeson 3
UNCLASSIFIED - NON CLASSIFI What is the UPD? The Usability Performance Dashboard (UPD) is a data- driven service that allows CRA employees to save time through quick access to data, so more time can be spent improving services for individuals and businesses. Who is the UPD for? UX and content practitioners: To quickly measure performance, make content and design decisions and enhance user experience. Content authors: To assess the performance of their content and inform design choices. CRA teams and executives: To see how products and services are performing at a glance. 4
UNCLASSIFIED - NON CLASSIFI Business Value Key Metrics Easy Access to Data and Analytics: Provides quick access to data and analytics in one place. Connected Data Sources: Integrates insights across data points and channels, creating a comprehensive view of user behaviors. Informed Decision Making: Enables evidence-based decisions leading to real improvements. Continuous Monitoring: Helps stay proactive by monitoring trends. Enhanced Prioritization and Efficiency: Provides a structured approach to organizing, prioritizing, and tracking task performance. 580+ User Tasks tracked 55,000+ Canada.ca Pages tracked 500K+ Page feedback comments Call volume 4.5m+ calls 71 Completed UX Projects tracked 500+ Participants trained to use UPD at CRA 5
UNCLASSIFIED - NON CLASSIFI Adoption The UPD is now integrated into our daily processes including the User-Centred Design (UCD) process. Monitor & refine phase Initiate phase Discover phase Design phase Deliver phase Using data in the discovery phase provides us with insights that shape decision-making early on, enabling evidence-based, user-centred design. By monitoring feedback after changes, we can continually refine and improve user experiences. 6
UNCLASSIFIED - NON CLASSIFI Data Sources 8 Data Sources: 1. 2. 3. 4. 5. 6. 7. 8. Page Inventory Call Centre Data Task Inventory Page Feedback Tool Google Search Data Web Analytics UX Testing Results GC Task Success Survey 7
UNCLASSIFIED - NON CLASSIFI Task Management We manage user tasks through a structured process that enables us to: Maintain a record of tasks visitors come to the CRA website to complete. Categorize tasks and connect them with relevant data points for better organization and analysis. Measure task performance over time, allowing us to make actionable improvements. This process supports iterative improvements, moving beyond data collection and reporting to support continuous improvement. 8
UNCLASSIFIED - NON CLASSIFI UPD Demo 9
UNCLASSIFIED - NON CLASSIFI Case Study #1 Content Authors How they use UPD? Content Optimization: Identify and address trends in negative feedback. Group of content creators responsible for maintaining a portion of the website. Focus Area: Individual pages or sets of pages within their assigned section of the site. Search Optimization: Align page metadata and content with user language. Goal: To ensure their content aligns with user needs and supports usability standards within their scope of responsibility. Prioritization: Focus on improving high-impact pages based on user feedback. Reporting: Create monthly report targeted to their group summarizing trends and recommendations. Key Data Page Feedback Tool Web Analytics Sources Collaboration: Share insights to support decisions. Google Search Data more 10
UNCLASSIFIED - NON CLASSIFI Case Study #1 Content Authors Solution: The user interface was changed substantially to make it easier to use. Data from Page Feedback Tool Users frequently indicated they Didn t find what they were looking for and mentioned difficulties and confusion in using the calculator Problem GST/HST Calculator page saw the number of comments from visitors increasing relative to visits in early 2024 Results Key Data Page Feedback Tool Web Analytics Sources Google Search Data more 11
UNCLASSIFIED - NON CLASSIFI Case Study #2 Content Optimization Project My Account How they use UPD? Content Optimization: Identify and address trends in negative feedback and call volumes Multidisciplinary teams include content designers, strategists, usability designers researchers, program stakeholders and data analysts. Prioritization: Focus on identifying and improving high-impact pages based on user feedback. Focus Area: Sets of pages for selected group of tasks. Reporting: Create monthly reports summarizing trends and recommendations. Goal: To improve task success, improve findability and reduce related phone calls and negative feedback. Collaboration: Share insights to support localized decisions. Key Data Page Feedback Tool Web Analytics Sources Google Search Data Call Centre Data 12
UNCLASSIFIED - NON CLASSIFI Case Study #2 Content Optimization Project My Account Solution: The redesigned registration page has clear buttons to start the registration process. Data from Page Feedback Summary Users frequently mentioned difficulties in finding a clear and direct link or button to start the registration process. They expressed frustration about not being able to locate the actual registration form. Problem The registration instructions described in detail the registration process, but didn t have a link or button to start the registration process. Result: Negative feedback for this task decreased by 51% and calls per 100 visits decreased by 42%. Key Data Page Feedback Tool Web Analytics Sources Google Search Data Call Centre Data 13
UNCLASSIFIED - NON CLASSIFI Future of UPD 1. Enhanced AI Capabilities: Introduce qualitative data analysis of user feedback to identify trends, improve content, and streamline processes. 2. Data Source Integration: Expand data sources to include chatbot interactions and establish tighter integrations with call center data for a more holistic view of user behavior. 3. Streamlined Task Management: Improve task management functionality to support ongoing monitoring of top tasks and collaboration with partners for better decision making. "Data will talk to you if you re willing to listen." Jim Bergeson Tools for Data Listening: Prioritize evolving tools like the UPD to effectively capture and interpret feedback. Evolving Infrastructure: Invest in scalable systems to integrate new data sources and adapt to user needs. Commitment to Success: Continuously upgrading tools and infrastructure and ensuring data analysis is embedded in all processes will help to stay aligned with goals. 14
UNCLASSIFIED - NON CLASSIFI Thank You Questions? 15