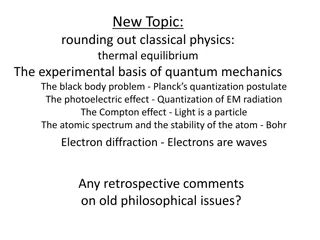
Photoelectric Effect and Compton Effect in Physics
Learn about the photoelectric effect, maximum kinetic energy of electrons, equations involved, applications, Compton effect, Compton shift, and the experiments conducted by Arthur Compton. Explore how photons transfer momentum and energy in these fundamental processes in physics.

Download Presentation

Please find below an Image/Link to download the presentation.
The content on the website is provided AS IS for your information and personal use only. It may not be sold, licensed, or shared on other websites without obtaining consent from the author. If you encounter any issues during the download, it is possible that the publisher has removed the file from their server.
You are allowed to download the files provided on this website for personal or commercial use, subject to the condition that they are used lawfully. All files are the property of their respective owners.
The content on the website is provided AS IS for your information and personal use only. It may not be sold, licensed, or shared on other websites without obtaining consent from the author.
E N D
Presentation Transcript
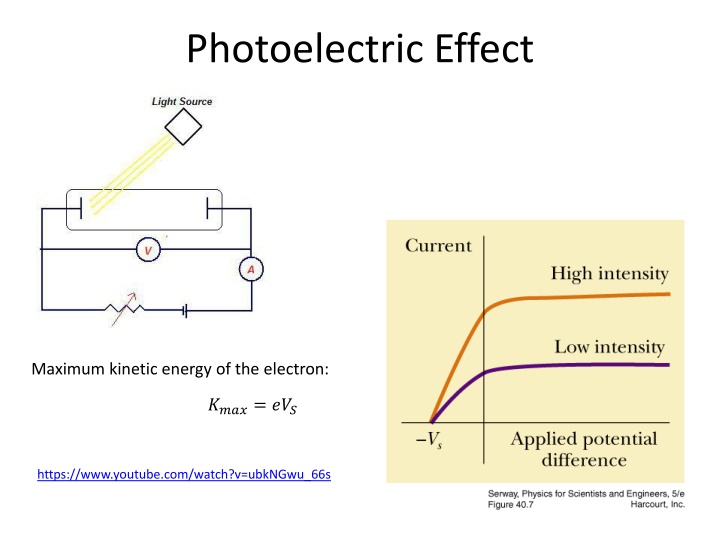
Photoelectric Effect Maximum kinetic energy of the electron: ????= ??? https://www.youtube.com/watch?v=ubkNGwu_66s
Photoelectric Effect: Equation ????= ? ? Work function =
Photoelectric Effect https://www.youtube.com/watch?v=ubkNGw u_66s https://www.youtube.com/watch?v=wFY9ZvU mM5o (UC Berkeley) https://www.youtube.com/watch?v=7wF8Jm5 Zhvk
Applications https://www.youtube.com/watch?v=nrCEVbS 2oeo
Compton Effect A quantum of light has linear momentum (Einstein 1916). For a photon with energy hf, the magnitude of that momentum is: In 1923, Arthur Compton, carried out an experiment that supported the view that both momentum and energy are transferred via photons. He arranged for a beam of x rays of wavelength to be directed onto a target made of carbon, as shown. An x ray is a form of electromagnetic radiation, at high frequency and thus small wavelength. Compton measured the wavelengths and intensities of the x rays that were scattered in various directions from his carbon target.
Compton Shift Figure below shows his results. Although there is only a single wavelength ( = 71.1 pm) in the incident x-ray beam, we see that the scattered x rays contain a range of wavelengths with two prominent intensity peaks. One peak is centered about the incident wavelength , the other about a wavelength that is longer than by an amount , which is called the Compton shift. The value of the Compton shift varies with the angle at which the scattered x rays are detected and is greater for a greater angle. Derivation The quantity h/mc in is a constant called the Compton wavelength. Its value depends on the rest mass m of the particle from which the x rays scatter.