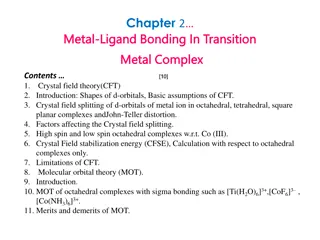
Photonic Crystal Band Gap Analysis with COMSOL Simulation
Explore the wave propagation in a photonic crystal made of GaAs pillars to uncover photonic band gaps preventing specific wavelengths from propagating. Learn about the model, electromagnetic wave analysis, and results obtained through simulation.

Download Presentation

Please find below an Image/Link to download the presentation.
The content on the website is provided AS IS for your information and personal use only. It may not be sold, licensed, or shared on other websites without obtaining consent from the author. If you encounter any issues during the download, it is possible that the publisher has removed the file from their server.
You are allowed to download the files provided on this website for personal or commercial use, subject to the condition that they are used lawfully. All files are the property of their respective owners.
The content on the website is provided AS IS for your information and personal use only. It may not be sold, licensed, or shared on other websites without obtaining consent from the author.
E N D
Presentation Transcript
Introduction The model investigates the wave propagation in a photonic crystal that consists of GaAs pillars placed equidistant from each other The distance between the pillars determines a relationship between the wave number and the frequency of the light that prevents light of certain wavelengths to propagate inside the crystal structure This frequency range is called the photonic band gap There are several band gaps for a certain structure, and this application extracts the band gaps for the lowest bands of the crystal
Model Definition The range for the swept k is determined by the reciprocal lattice vectors of the photonic crystal, and these are determined from the primitive lattice vectors For a 2D crystal there are two lattice vectors, a1 and a2, defined in the figure Definition of the square primitive cells and the lattice vectors a1 and a2
Model Definition Electromagnetic Waves, Frequency Domain
Model Definition Electromagnetic Waves, Frequency Domain 2
Results The figure shows the z- component of the electric field, as determined by the eigenfrequency solver for k=0 Z-component of the electric field for k = 0
Results The figure shows the z- component of the electric field for k = 0.5 for the fifth band, as determined by the nonlinear solver Z-component of the electric field for the fifth band and k = 0.5
Results Finally, the figure shows the band diagram for k swept from 0 to 0.5 in the (1,1) direction Notice that band two and three are degenerate for k=0, and that band one and two and four and five are degenerate at k=0.5 Between band three and four there is a frequency range for which there are no states The dispersion relation (frequency versus wave number), when the wave vector is varied in the direction (1,1), for the five lowest bands
Results This frequency range corresponds to a band gap in the structure, as there can be no propagating waves in the (1,1) propagation direction for that frequency range Notice that there is actually a band with a lower frequency than for the lowest band in the figure The dispersion relation (frequency versus wave number), when the wave vector is varied in the direction (1,1), for the five lowest bands
Results However, this band has so small frequencies that the approximation for the frequency- dependent refractive index of GaAs is no longer valid Thus, this band has not been included in the calculations The dispersion relation (frequency versus wave number), when the wave vector is varied in the direction (1,1), for the five lowest bands