Physics Error Analysis Lab: Graphing Water Density
Explore uncertainties in mass and volume measurements to analyze water density through graphing error analysis in a physics lab. Students collect data, calculate averages, plot points with error bars, determine best-fit lines, and compare results with the accepted density of water.

Download Presentation

Please find below an Image/Link to download the presentation.
The content on the website is provided AS IS for your information and personal use only. It may not be sold, licensed, or shared on other websites without obtaining consent from the author. If you encounter any issues during the download, it is possible that the publisher has removed the file from their server.
You are allowed to download the files provided on this website for personal or commercial use, subject to the condition that they are used lawfully. All files are the property of their respective owners.
The content on the website is provided AS IS for your information and personal use only. It may not be sold, licensed, or shared on other websites without obtaining consent from the author.
E N D
Presentation Transcript
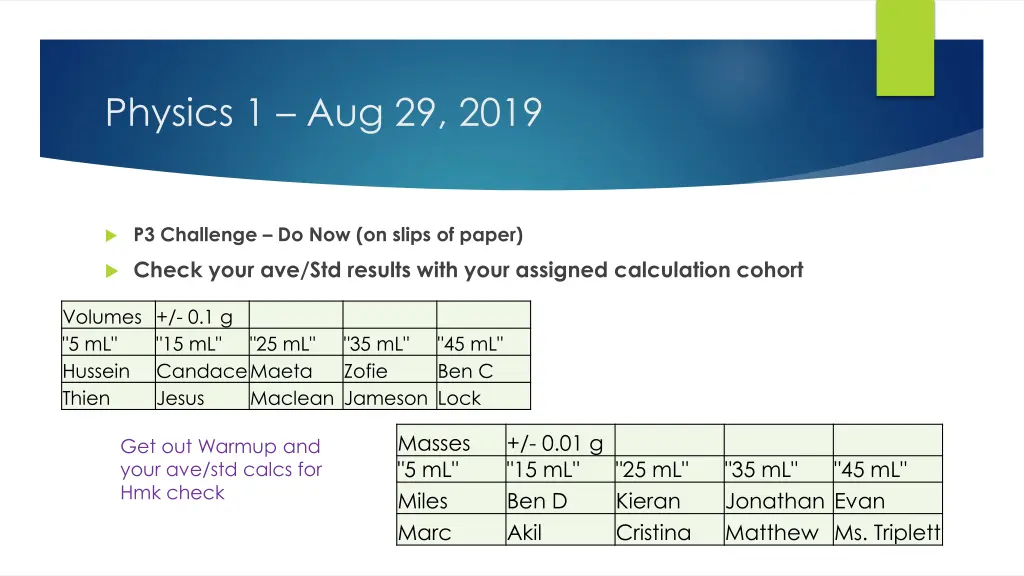
Physics 1 Aug 29, 2019 P3 Challenge Do Now (on slips of paper) Check your ave/Std results with your assigned calculation cohort Volumes +/- 0.1 g "5 mL" Hussein Thien "15 mL" CandaceMaeta Jesus "25 mL" "35 mL" Zofie "45 mL" Ben C Maclean Jameson Lock Masses "5 mL" Miles Marc +/- 0.01 g "15 mL" Ben D Akil Get out Warmup and your ave/std calcs for Hmk check "25 mL" Kieran Cristina "35 mL" Jonathan Evan Matthew Ms. Triplett "45 mL"
Objectives and Agenda Objectives Agenda 1.2 Uncertainties and Errors Post ave/std data on board for everyone. Find the ave of the volume stds and the ave of the mass stds. We will assume these are the same uncertainties for all points. Create your graph Assignment:Complete the Graphing Error Lab Perform the Error analysis State your results.
Graphing Error Lab Overview Collect Mass and Volume Data for water for volumes of APPROX 5, 15, 25, 35, 45 mL. (be sloppy) Record the actual volume used. (Do NOT use exactly 5.0 mL etc ) Record the mass to 2 decimal places using an electronic balance. (Don t bother to tare) Share your data with the class on the board and copy all class data. Find ave and std dev of all volume and mass data. (Divide and conquer.) Plot points (mass vs volume) with error bars for each point reflecting std devs Determine min/max lines to asses uncertainty in slope and intercept. (use colors) Determine best fit line with uncertainties for the density of water. Compare results to accepted 1.00 g/mL with a % error.
Graphing Error Analysis Review Determine two points on each max/min line generated from the extreme point error boxes Decide on IV and DV variables. Title the graph and the two axes. Use algebra to determine the slope and intercept of the max and min lines Decide on scales for both axes. Find the (max min)/2 for slope to determine the uncertainty in the best fit slope. Plot points. Draw error bars for extreme points (or all) Find the (max min)/2 for the intercepts to determine the uncertainty in the best fit intercept. Draw best fit line. Find two points on best fit line. Write summary equation for the best fit line with uncertainties. Use algebra to find slope of and intercept of the best fit line. Determine the percent error, if appropriate. Draw the max and min slope lines
Exit Slip - Assignment Exit slip In detail, how does one draws a maximum slope line? What s Due? (Pending assignments to complete.) Complete the Graphing Error Density of Water Lab (attach your graph) What s Next? (How to prepare for the next day) Read IB 2.1 p35-44