Physics Measurement and Motion Concepts
Explore objectives in physics related to measurement, uncertainties, errors, and 1-dimensional motion. Dive into position vs. time graphs and more.

Download Presentation

Please find below an Image/Link to download the presentation.
The content on the website is provided AS IS for your information and personal use only. It may not be sold, licensed, or shared on other websites without obtaining consent from the author. If you encounter any issues during the download, it is possible that the publisher has removed the file from their server.
You are allowed to download the files provided on this website for personal or commercial use, subject to the condition that they are used lawfully. All files are the property of their respective owners.
The content on the website is provided AS IS for your information and personal use only. It may not be sold, licensed, or shared on other websites without obtaining consent from the author.
E N D
Presentation Transcript
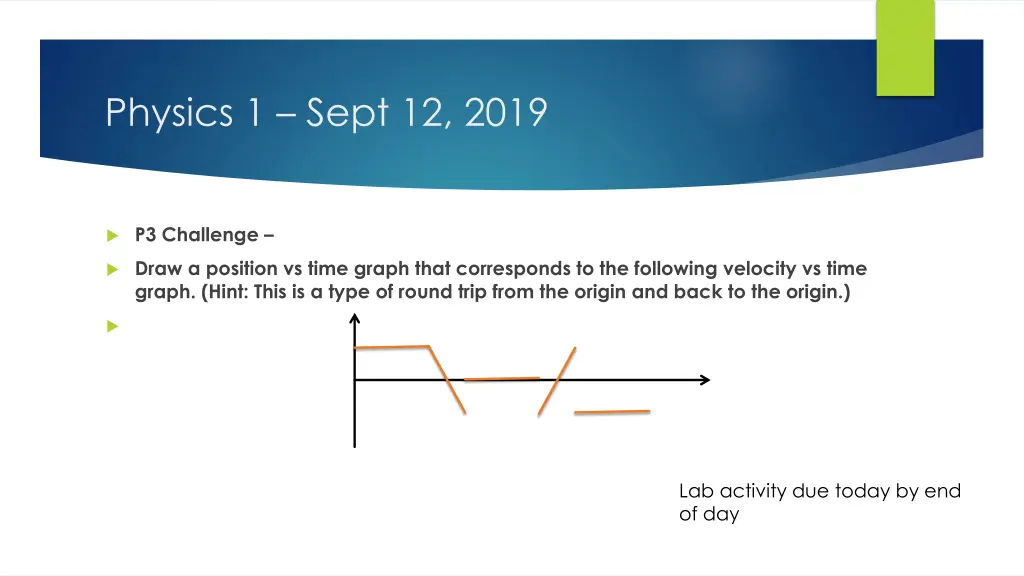
Physics 1 Sept 12, 2019 P3 Challenge Draw a position vs time graph that corresponds to the following velocity vs time graph. (Hint: This is a type of round trip from the origin and back to the origin.) Lab activity due today by end of day
Objectives and Agenda Objective Review day Agenda Omelet Review Time to work on review worksheet Assignment: Work with study guide and review worksheet to review (Test on Tuesday 9/17)
IB 1.1 Objectives Measurement in Physics Measuring Significant figures Scientific Notation Calculations with sigfigs Standards Metric units Unit conversion Dimension Analysis Estimation
IB 1.2 Objectives Uncertainties and Errors Sources of error Accuracy and Precision Data Analysis (ave and std) Error propagation: add/sub, mult/div, exponents and roots Error in Graphs Lab activity (density of water graph)
IB 2.1 Objectives Motion (1 Dimensional) Position, Displacement and Distance Average speed, average velocity Instantaneous velocity Acceleration X vs t graphs V vs t graphs Constant acceleration problems Freefall Lab activity (ruler reaction time)
Vocabulary Standard Estimate Order of magnitude Dimensional analysis Mantissa Accuracy Precision Systematic error Random error Range Standard deviation Absolute uncertainty Fractional uncertainty Percent uncertainty Error propagation Percent error Error Bar Gradient Position Displacement Distance Speed Velocity Scalar Vector Average velocity Instantaneous velocity Acceleration g , gravity
Memory Items g = -9.81 m/s2 The five most common metric prefixes (k, d, c, m, ) Variables for constant acceleration, and their units Meter stick equivalences mL conversions v = 0 at top of motion and other freefall features 1 in = 2.54 cm Std Dev steps Density of water = 1.0 g/mL 1 m = 100 cm 1 m = 1000 mm 1000 m = 1 km 1 mL = 1 cm3 = 1 cc 1 g of water = 1 mL applies to L and g also
Skills 1.1 Measurement in physics Measure mass, distance or volume with lab equipment using the correct level of uncertainty Convert between scientific notation and standard notation Calculate with significant figures (count, add/sub, mult/div) Perform dimensional analysis using equivalences to do unit conversions Convert SI metric units Answer questions to one sig fig and order of magnitude estimates
Skills 1.2 Uncertainty and Error Analysis Identify sources of error for a laboratory procedure Determine accuracy of a data set using average and percent error Determine precision of a data set by using the rule of the range or a standard deviation Report uncertainties to one sigfig and round values to the decimal point indicated by the uncertainty
Skills 1.2 Uncertainty and Error Analysis Calculate the absolute uncertainty, fractional uncertainty or percent uncertainty for a measurement Propagate uncertainties through calculations involving addition/subtraction, multiplication/division or exponents/roots Evaluate the uncertainty present in the plotted points, gradient and y-intercept of a graph using error bars and min/max/best lines
Skills 2.1 Motion ( 1 dimension) Distinguish between position, displacement and distance Distinguish between speed and velocity Calculate average velocity Determine the direction of acceleration Interpret and draw position versus time kinematic graphs Interpret and draw velocity versus time kinematic graphs Solve constant acceleration problems Solve freefall motion problems
Test Description 13 x 2 pts Multiple Choice 8 pts Short answer calculations 26 pts Graphing (4 x 3 pts Basic x vs t and v vs t + 8 pts combined problem + 6 pt Graph Error Analysis) 3 x 3 pts Error Propagation 3 pt Estimation 2 x 4 pt Constant velocity problems 4 x 5 pts Constant acceleration and freefall problems
Exit Slip - Assignment No Exit Slip What s Due? (Pending assignments to complete.) Work with study guide and review worksheet to review What s Next? (How to prepare for the next day) Test on Thursday Sept 17.


")