PHYSTAT: Statistical Issues in Particle Physics Workshops
Delve into the world of Particle Physics at PHYSTAT workshops, where physicists and statisticians come together to explore statistical topics relevant to particle analyses. Learn about the history, previous meetings, and upcoming events in the field. From understanding deep neural networks to machine learning applications, PHYSTAT provides a platform for in-depth discussions and advancements in high-energy physics research.

Download Presentation

Please find below an Image/Link to download the presentation.
The content on the website is provided AS IS for your information and personal use only. It may not be sold, licensed, or shared on other websites without obtaining consent from the author.If you encounter any issues during the download, it is possible that the publisher has removed the file from their server.
You are allowed to download the files provided on this website for personal or commercial use, subject to the condition that they are used lawfully. All files are the property of their respective owners.
The content on the website is provided AS IS for your information and personal use only. It may not be sold, licensed, or shared on other websites without obtaining consent from the author.
E N D
Presentation Transcript
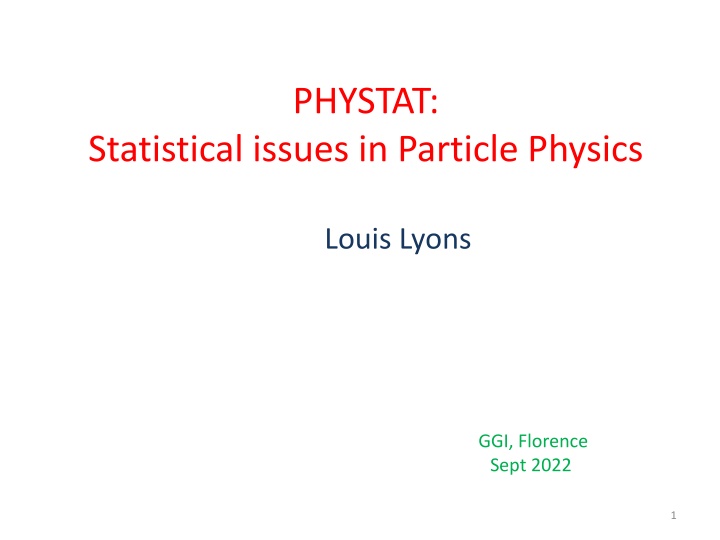
PHYSTAT: Statistical issues in Particle Physics Louis Lyons GGI, Florence Sept 2022 1
Topics What is PHYSTAT? PHYSTAT-Anomalies Workshop Model independent searches for New Physics (~ML) Questions: Understanding how deep NNs work 2
PHYSTAT 3
PHYSTAT Statistical issues for Particle Physics analyses. Workshops and Seminars involving Particle Physicists and Statisticians 4
PHYSTAT History 1999: Idea for having first meeting devoted to statistical issues for Particle Physics analyses 2000: First PHYSTAT Workshop, on Upper Limits. Organised with Fred James & Yves Perrin 2000 : PHYSTAT Workshops 2018: Olaf Behnke takes over as Chair of PHYSTAT 2019: Olaf institutes PHYSTAT Seminar series. Website: https://espace.cern.ch/phystat/_layouts/15/start.aspx#/SitePages/Home.aspx 5
PHYSTAT History 1999: Idea for having first meeting devoted to statistical issues for Particle Physics analyses 2000: First PHYSTAT Workshop, on Upper Limits. Organised with Fred James & Yves Perrin CERN confronts the New Millennium with Confidence (Bulletin, 3/2000) 2000 : PHYSTAT Workshops 2018: Olaf Behnke takes over as Chair of PHYSTAT 2019: Olaf institutes PHYSTAT Seminar series. Website: https://espace.cern.ch/phystat/_layouts/15/start.aspx#/SitePages/Home.aspx 6
Previous PHYSTAT meetings Upper Limits: CERN and Fermilab LHC: CERN (twice, once including Unfolding) Neutrinos: IPMU Japan, Fermilab, CERN Dark Matter: Stockholm Flavour: Remote General Statistical Issues: SLAC, Durham, Oxford Systematics Anomalies Specific Stat topic Specific Physics area General
PHYSTAT near future High Energy Gamma Ray Astronomy in a Multi-Wavelength Context , https://indico.cern.ch/event/1122011/ , 27-30 Sep 2022 PHYSTAT-Gamma Workshop, 12th Oct 2022, Philipp Windischhofer (Chicago), "Optimal Transport in HEP: theory and applications "Using Machine Learning to Get Serious about Systematics" 26th Oct 2022, Daniel Whiteson (Irvine), 16th Nov 2022, Michael Kagan (SLAC) "On relating Uncertainties in Machine Learning and HEP 25th Jan 2023, Jesse Thaler (MIT), Topic not yet decided 8
Kyle Cranmers talk at PHYSTAT-Systematics: Four approaches to Systematics with ML How many talks on Systematics and ML ? Propagation of errors: one works with a model and simply characterizes how uncertainty in the data distribution propagate through the function to the down- stream task irrespective of how it was trained. Data augmentation: one trains a model in the usual way using training data from multiple domains by sampling from some distribution over . Domain adaptation: one incorporates knowledge of the distribution for domains (or the parameterized family of distributions ) into the training procedure so that the performance for the down-stream task is robust or insensitive to the uncertainty in . Parameterized models: instead of learning a single function of the data , one learns a family of functions that is explicitly parameterized in terms of nuisance parameters and then accounts for the dependence on the nuisance parameters in the down- stream task (No time for systematics related to ML process) 10
A Method of Reducing Systematic Errors in Classification Problems, https://cds.cern.ch/record/2629169/files/delphi-92-117_ocr.pdf Delphi note, Aug 1992 11
Concept of PHYSTAT-Anomalies meeting PHYSTAT-Anomalies: A workshop on model independent searches. (May 24th & 25th 2022) Many newish model-independent NP1 searches for NP2 (including NP3, but not NP4) mainly using ML. NP1 = Non-Parametric NP2 = New Physics NP3 = Nuisance Parameters NP4= Neyman-Pearson 1: Compare and contrast different approaches 2: Model-independent = Goodness of Fit Vast statistics literature on GoF. Can methods make use of this? Mainly 2-afternoons, each with 3 talks, plus discussion time and Personal thoughts Several statisticians involved:: David van Dyk, Mikael Kuusela, Ann Lee, Richard Lockhart, Larry Wasserman, . Website https://indico.cern.ch/event/1138933/ 329 registrations. Largest number of participants 142 12
Inspiration for meeting Andrea Wulzer CERN DS Seminar Email exchanges among AW, Maurizio Pierini, Bob Cousins 13
List of talks, etc. BEFORE: Wulzer: Motivation for meeting Bob Cousins emphasis on Goodness of Fit Mikael Kuusela: Model indep detection of NP signals using interpretable semi-supervised classifier tests DURING: LL: Intro Ben Nachman: Landscape of model independent searches Andrea Wulzer: Learning NP from a machine Larry Wasserman: Goodness of Fit, and 2-sample tests Bob Cousins: Thoughts, day 1 Innes Ochoa: Challenges of anomaly detection ATLAS dijets Gregor Kasieczka: LHC Olympics Sascha Caron: Supervised, unsupervised & data driven signal regions Richard Lockhart: Thoughts, day 2 Olaf Behnke: Closing remarks Statistician AFTER: Maurizio Pierini s comments Discussion on What is Rare? 14
Introduction (LL) TOPICS Are model-independent and model-dependent opposite ends of a continuous spectrum; or distinct? Options for methods: Believe background MC? Or choose control region depleted in signal Choice of data Input variables: (px , py , pz,, m) or higher level variables Binned or unbinned data Data statistic Loss function Form of anomaly: 1-D v multi-D; Peak or enhancement or any? Can method target types of anomalies? (cf. Kolmogorov-Smirnov or Anderson-Darling) Provide info on where anomaly is? Systematics from ML procedure; and other systematic issues LEE: Local or global p-value? Where is Elsewhere ? Publish discrepancies straight away or first confirm via model dependent approach? What to publish if nothing found? How to compare different anomaly detectors? Benchmarks for checking power. 15
Mikael Kuuselas PHYSTAT Seminar "Model-Independent Detection of New Physics Signals Using Interpretable Semi-Supervised Classifier Tests See arXiv:2102.07679 [stat.AP] Assume reliable sample for bgd, but not for signal. 1) Is there evidence for signal? 2) What are signal fraction and shape? Example of 2 sample test; and anomaly detection. Differs from event-by-event outlier detection. For high-D input space, use classifier (For H0, no difference between data & bgd) New ideas: How to obtain test statistic from Classifier Ways to calibrate tests LRT, AUC, MCA = Misclassification Error Estimating signal strength Interpreting signal via active subspaces 16
Kuusela seminar, contd Estimate null dist of test statistic by asymptotics, permutation or bootstrap Use half data to train; other half to evaluate Test on ATLAS MC H data (15 inputs per event) Power compared for LRT, AUC & MCE with Asymptotic, Bootstrap & Permutation as function of signal strength. Demonstrates robustness of semi-supervised wrt model mis-specification. Determine signal strength via Neyman-Pearson quantile transform. Use fitted classifier surface h Where data differs from bgd ( active subspaces ) Perform PCA on grad(h). Eigenvector plot shows contribution of each input. Systematics not yet included, so discrepancy could be mismodeled bgd. Requires new statistical methodology. D Agnolo et al is good step towards this. 17
Ben Nachman Landscape of model-independent searches No free lunch. Model independence loss of power Look everywhere? Everywhere is too big. Characterises searches by degree of bgd independence and signal independence Supervision: Unsupervised = no labels Weakly-supervised = noisy labels Semi-supervised = partial labels Supervised = full label information Approach Unsupervised Weakly supervised BSM assumption Signal is rare* (low p) Signal is overdensity (high p ratio) Main drawback Rare is not invariant Under co-ord transform Needs 2 samples * For a detailed discussion about this, see K. Desai, BN, J. Thaler, 2112.05722 Need benchmarks: LHC Olympics 2022 & Dark machines Conclusions: It is an exciting time to work on anomaly detection for the LHC and beyond! This is a rapidly growing area with lots of room for innovation (and from physicists!) We will need many approaches to achieve broad coverage See the Living Review for many more refs! https://arxiv.org/pdf/2102.02770.pdf 18
Andrea Wulzer Learning NP from an (Imperfect) Machine See D Agnolo et al https://arxiv.org/pdf/2111.13633.pdf Regular Model-indep: e.g. Bump hunt ML Model-indep: Completely eliminate modelling Strategy n(x|w) = n(x|R) x exp{f(x;w)} Actual dist Reference dist Flexible function = NN Introduces zideal, to quantify how much model-independent search loses. What is LEE? 19
Gregor Kasieczka: LHC Olympics 2020 Challenge to find anomalies in generated data sets. Aim: Find p-values, signal strength, description of signal. Training example: 1M SM background + 105signal events of 3.5TeV Z XY 4 jets Black box 1: Easy signal Black box 2: No signal Several found anomalies Black box 3: More difficult signal No-one found it 9 unsupervised 5 weakly supervised 4 semi-supervised Need for standard benchmark alternatives for testing power 20
Ines Ochoa: Challenges of anomaly detection at LHC ATLAS dijets A B+C Classification without labels: CWoLa Does not rely on bgd simulation Minimise dependence on signal and on bgd models. Uses NN to select 2 data samples with different s/b ratios (Values of s/b not needed). Effic of cuts = 1% or 10% Uses 6 signal regions in mjj, each along with 2 sidebands. Claim that LEE factor kept to 6. Uses k-fold cross-validation Inputs to NN decorrelated. Assume bgd in signal and sideband regions are same. Bgd fitted by parametric forms Setting limits is complicated Needs large computing resources [Need to train O(10K) NNs] Published: ATLAS Collaboration, Phys.Rev.Lett. 125 (2020) 13, 131801 21
Sascha Caron Supervised, unsupervised and data-derived signal regions Possible extensions of model-dependent searches: a) Brute force = look everywhere ATLAS: Step 1 = general search (~105 signal regions/HTs) Step 2 = model dependent follow-up with new data, on interesting regions from Step 1 1st dataset corrected with trial factor, 2nd dataset no need for correction ? b) Train ML classifier on many models of NP Cf: LL, A Method of Reducing Systematic Errors in Classification Problems , NIM 324 (1993) 565 c) Train ML classifier just on H0 = SM (& detector) Which variable for search? 22
Larry Wasserman: Goodness of Fit Topics: optimal tests, classifier-based tests, reproducing kernel Hilbert space tests, level set tests, bump tests and robustness. Optimal tests? Mini-max maximises minimum power. Not very powerful. Jensen: Any test has substantial power only in finite number of dimensions. Some GoF Tests (Subsequently, list of GoF methods from Wolfgang) Polonik Level Set Test Bickel-Breiman Nearest Neighbour Test Neyman Smooth Test: targets certain directions (See Algeri) For given signal: Likelihood Ratio, or Score Bump Test for 1D: Use local polynomial density estimator, rather than histogram Robustness: Trade-off with power Classifier Tests: Current fashion = deep NNs. Or Random Forests, Logistic Regression Just dimension reduction Error control: Classify and testing with same data invalid p-value Remedy: Permutations or Data Splitting Not known whether classifiers are better than other tests. Don t assume NNs are optimal. 23
Bob Cousins: Thoughts, day 1 Machines free us from parametric methods Try to generalize saturated model for histograms (Baker & Cousins) to unbinned data. Hopes ML will work with unbinned multi-D data Neyman smooth test could do this. Tests of optimality. Bob does not like AUC for ROC curves. Performance at working point is more relevant. Bob likes Mikael s active subspaces for identifying where anomaly is. Bob likes Andrea Wulzer s z v z* scatter plots. 24
Richard Lockhart: Thoughts, day 2 He is expert on GoF. Spoke about GoF, but not ML. Remember H0 = SM & Detector i.e. Has nuisance params. 3 possibilities: GoF with known functional form 2 sample test Identify candidates Effect of uncertainty in parameters Linearization of H in near 0 Use MLE: variability reduced often a lot. Use uncertain estimate from other data: variability increased. So increased by systematics, decreased by fitting. Maximal decrease by Maximum Likelihood. Compare David van Dyk introductory talk at PHYSTAT-Systematics David van Dyk question: Most people want to confirm H0. We want to reject it, and have high power against (un-)defined alternatives. Does that make a difference? 25
Comments by Mikael Kuusela Model (in-)dependence is spectrum. LEE: ML methods have it built in. Issue with post analysis inference: Same data used for Classification and for Inference What if searches don t find anything? How to characterize where power is high 26
Post meeting discussion Email from Maurizio Pierini Not enough CMS analyses (e.g. Thea, Jennifer) Critical of ATLAS di-jets, Academic exercise CMS derives bgd in mjj by MC-assisted data driven prediction No mention of use of ML in trigger, to select anomalous events. His conclusions: Abandon optimality Accept loss of sensitivity wrt specific search To be used as complement to model-specific searches What is Rare? Emails from Bob Cousins, Sascha Caron, Ben Nachman Sascha uses low prob density of bgd to define rare. But Bob points out that prob density is dependent on parametrization e.g pT2 distribution can peak at zero pT2; corresponding pT dist 0 at zero pT Sascha uses human intelligence to choose sensible parametrisation. 27
FUTURE Open issues: Divide data into 2, to avoid LEE? Need for benchmarks for characterizing power Need for statistical requirements for ML searches Do MCs adequately model high-D correlations that ML approaches can use? Variety of GoF methods. Is Neyman smooth test of relevance for us? Methods of characterizing power. Possible events PHYSTAT-Seminars Small discussion meetings (live?) Your ideas Upcoming PHYSTAT events: Workshop: PHYSTAT-gamma, Sept 27th 30th , Astro high energy gammas PHYSTAT Seminar/Tutorial: Mikael, July 20th , Gaussian Processes PHYSTAT Seminars: Daniel Whiteson, Michael Kagan, ML & Systematics Philipp , Windischhofer, Jesse Thaler 28
MULTIVARIATE ANALYSIS Example: Aim to separate signal from background Neyman-Pearson Lemma: Imagine all possible contours that select signal with efficiency (Loss = Error of 1st Kind) Best is one containing minimal amount of background (Contamination = Error of 2nd Kind) v2 Equivalent to ordering data by L-ratio = Ls(v1, v2, .) / Lb(v1, v2, ) v1 IF variables are independent L-ratio = {Ls(v1)/Lb{v1)} x {Ls(v2)/Lb(v2)} x .. 30
HOW DOES IT WORK? Input Hidden Output Layer Layer(s) Layer For each hidden or output node j Outputj= F [ Inputi * Wij + Tj] Higher (W and T = network params) Typical F(x) = 1/(1+ e- x) Sigmoid For large , output of node j is ON if Low Ii wij +Tj> 0 , and OFF otherwise Dividing contour is hyper-plane in I space 31
HOW DOES IT WORK? v1 v2 v2 Input Hidden Output Layer Layer(s) Layer v1 For First hidden node Straight line is w11*v1 + w21*v2 +T10 = 0 where wij is weight from ith input node to jth hidden node Tk0 is threshold for kth hidden node 32
HOW DOES IT WORK? v1 v2 v2 Input Hidden Output Layer Layer(s) Layer Output = Sigmoid{H1 + H2 + H3 2.5 } Output is On only if H1 H2 H3all are On v1 N.B. * Complexity of final region depends on number of hidden nodes. * Finite rounded edges for selected region; and contours of constant output in (v1, v2) plane. 33
When do we need more than one Hidden Layer? v1 v2 Input nodes connected to all 1st hidden layer nodes v1 H7 Output 1st hidden layer nodes connected to 2nd hidden layer nodes in same rectangle H8 v2 Output = Sigmoid{H7 + H8 0.5} i.e. Output is ON if either or both of H4 and H5 are ON (logical OR) . 34
Another example Wanted region is between the two curves. i.e. Above the red curve AND Below the blue curve This is achieved by: Output = Sigmoid{H7 + H8 1.5} Requires both H7 AND H8 to be on 35
Conclusion re multi-layer NN * Need more than one hidden layer for non-convex region * Complicated series of OR s or/and AND s needs many hidden layers but they are not fully connected. * Is it possible to understand what is gained from fully connected deep NN? 36
OTHER QUESTIONS GoF from unbinned likelihood Systematics for ML procedure LEE for model independent searches Training samples: Ensuring multi-D correlations are OK Do they cover multi-D region of data? Set of statistical protocols FINAL ADVICE Don t invent your own new method of analysis ( square wheel ) when Statisticians/ML experts have their circular wheel approaches. 37


")