Piping and Instrumentation Diagram (P&ID) Overview
A Piping and Instrumentation Diagram (P&ID) is a crucial process documentation tool using graphical symbols to represent a process's technical details. This guide covers the definition, benefits, main contents, software options, and tips for creating P&IDs, along with illustrative examples. P&IDs help engineers and technicians understand process connections efficiently, leading to increased productivity, better compliance, and streamlined processes.
Download Presentation

Please find below an Image/Link to download the presentation.
The content on the website is provided AS IS for your information and personal use only. It may not be sold, licensed, or shared on other websites without obtaining consent from the author.If you encounter any issues during the download, it is possible that the publisher has removed the file from their server.
You are allowed to download the files provided on this website for personal or commercial use, subject to the condition that they are used lawfully. All files are the property of their respective owners.
The content on the website is provided AS IS for your information and personal use only. It may not be sold, licensed, or shared on other websites without obtaining consent from the author.
E N D
Presentation Transcript
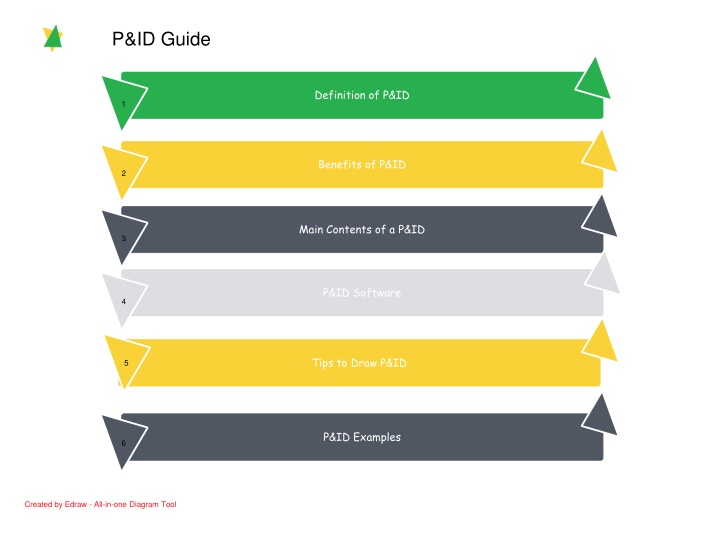
P&ID Guide Definition of P&ID 1 Benefits of P&ID 2 Main Contents of a P&ID 3 P&ID Software 4 Tips to Draw P&ID 5 P&ID Examples 6 Created by Edraw - All-in-one Diagram Tool Created by Edraw - All-in-one Diagram Tool
Definition of P&ID P&ID, short for piping and instrumentation diagram, is a process documentation representing technical realization of a process by means of graphical symbols, such as the service lines, instruments and controls, valves, and equipment. It is often used to by engineers and technicians to better understand the process and how the instrumentations are connected. Created by Edraw - All-in-one Diagram Tool Created by Edraw - All-in-one Diagram Tool
Benefits of P&ID Increase productivity and data quality, thus reducing project hours and costs Facilitate compliance with regulatory and safety requirements Streamline daily work processes Decrease time to market, achieving higher productivity and profitability Allow the management of global, multi-site projects Integrate with partner enterprises and associated tasks Reduce investment and increase Return On Assets (ROA)
Main Contents of a P&ID Instrumentation and designations; Mechanical equipment with names and numbers; All valves and their identifications; Process piping, sizes and identification; Miscellaneous - vents, drains, special fittings, sampling lines, reducers, increasers and swagers; Permanent start-up and flush lines; Flow directions; Interconnections references; Control inputs and outputs, interlocks; Seismic category; Interfaces for class changes; Quality level; Annunciation inputs; Computer control system input; Vendor and contractor interfaces; Identification of components and subsystems delivered by others; Intended physical sequence of the equipment; Equipment rating or capacity. Created by Edraw - All-in-one Diagram Tool Created by Edraw - All-in-one Diagram Tool
Edraw P&ID Software Thousands of predefined PID symbols, photorealistic, vector and easy-to-use. Support shape data, equipment report, hyperlink, multiple page document, large size print. A wide variety of readymade templates and examples. Edraw PID Software - Create Visual PIDs Instantly with Predefined Shapes Microsoft-like interface, intuitive and user- friendly. Edraw P&ID Software - Create Visual P&IDs Instantly with Predefined Shapes 100% compatible with MS programs. Created by Edraw - All-in-one Diagram Tool Created by Edraw - All-in-one Diagram Tool
Tips to Create P&ID Be consistent in using the symbols. Always keep a copy of the project s current Symbol and Legend sheet near for easy referral. 01 Text should not be smaller than 1/8" unless absolutely necessary. Text must be of adequate size to produce legible reproductions on reduced size prints of drawings. Take advantage of software to do it instead of drawing by hand, saving both time and effort. 04 02 03 Ensure accuracy. Less mistakes will actually lead to increased speed in the long run because repeated rework can be avoided. Created by Edraw - All-in-one Diagram Tool Created by Edraw - All-in-one Diagram Tool
Central Air Conditioning System Structure Diagram Feedwater Circulation Water Tank Cooling Tower Main Engine Condenser Evaporator Fan Coil Unit Temperature Measurement Resistor Freezing Pump Temperature Measurement Resistor Cooling Pump Temperature Measurement Resistor Smart Temperature Controller Smart Temperature Controller Created by Edraw - All-in-one Diagram Tool Created by Edraw - All-in-one Diagram Tool
13 Air bottle 10 Compressor 14 15 16 2 17 Set box 11 6 1 3 7 2 4 8 12 5 9 2 2 Created by Edraw - All-in-one Diagram Tool Created by Edraw - All-in-one Diagram Tool
Complete Set of Production Equipment and Process of Juice and Nectar Jacketed Pan Fruit Washing Machine Fruit Picking Machine Crush Deoxygenation Beater Blend Centrifugalization High-position Storage Tank Stabilization Tank Ultra High Temperature Sterilizer Filter Homogeneity Can Washing Machine Filling Machine Can Seamer Steam Sterilizer Created by Edraw - All-in-one Diagram Tool Created by Edraw - All-in-one Diagram Tool
