Plant Biodiversity Measurement Techniques
Explore the world of measuring plant biodiversity through various methods such as species diversity, abundance measurement, plot design, and diversity indices. Learn why it is essential to measure plant diversity and how it contributes to overall ecosystem health and understanding. Discover different aspects of plant diversity measurement and how it is calculated using diversity indices like the Shannon Index and Simpson Index. Take a closer look at the tools and techniques involved in measuring plant biodiversity, from choosing plots to calculating abundance and percent cover. Dive into the importance of biodiversity measurement in assessing the health and resilience of ecosystems.

Download Presentation

Please find below an Image/Link to download the presentation.
The content on the website is provided AS IS for your information and personal use only. It may not be sold, licensed, or shared on other websites without obtaining consent from the author. If you encounter any issues during the download, it is possible that the publisher has removed the file from their server.
You are allowed to download the files provided on this website for personal or commercial use, subject to the condition that they are used lawfully. All files are the property of their respective owners.
The content on the website is provided AS IS for your information and personal use only. It may not be sold, licensed, or shared on other websites without obtaining consent from the author.
E N D
Presentation Transcript
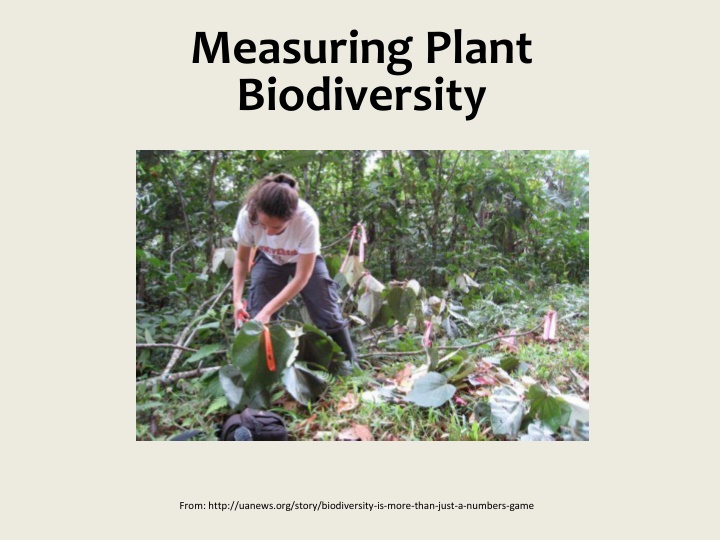
Measuring Plant Biodiversity From: http://uanews.org/story/biodiversity-is-more-than-just-a-numbers-game
Species Diversity Why Measure Plant Diversity?
Ecosystem Diversity How to Measure Plant Diversity?
Species Diversity What Aspects are Measured? Richness (the number of species) + Abundance (proportion of these species) Plot 1 Plot 2
Species Diversity Choosing a Plot What types of plants? How large of an area? 10 x 10 meters
Species Diversity Plot Design: Transects
Species Diversity Plot Design: Quadrats
Species Diversity Plot Design: Multi-scale Plots and Subplots
Species Diversity Measuring Abundance Cover From: hwwff.cce.cornell.edu The ACFOR scale for measuring species abundance A = ABUNDANT (greater than/equal to 30%) C = COMMON (20 to 29%) F = FREQUENT (10 to 19%) O = OCCASIONAL (five to nine per cent) R = RARE (one to four per cent) From: www.rgs.org/OurWork/Schools/Fieldwork+and+local+learning/Fieldwork+techniques/Ecosystems.htm
Species Diversity Measuring Abundance Percent Cover From: hwwff.cce.cornell.edu
Species Diversity Calculating Diversity: Diversity Indices Shannon Index Simpson Index Berger-Parker Index Renyi Entropy
Species Diversity Measuring Biodiversity: Curricula American Museum of Natural History: Students learn to calculate the biodiversity index for a site. They calculate the number of species in an area and divide them by the total number of individuals to get the index. http://www.amnh.org/explore/curriculum-collections/biodiversity-counts Association of Fish and Wildlife Agencies: Schoolyard Biodiversity Investigation Educator Guide. (Gr. 4) http://www.fishwildlife.org/files/ConEd- Schoolyard-Biodiversity-Guide.pdf National Wildlife Federation: Biodiversity Curriculum Connections: A comprehensive list of resources for teaching biodiversity to grades K 12. http://www.nwf.org/Eco-Schools-USA/Become-an-Eco- School/Pathways/Biodiversity/Curriculum.aspx National Institutes of Invasive Species Science: Monitoring protocols and methods outlined for use with older students. http://collaborativescience.org/DH.php?WC=/WS/CitSci/Tutorials_Wisconsin/T utorial3_Static.html