Plotting Linear Functions in Coordinate Geometry
Explore how to plot linear functions in coordinate geometry by understanding equations and coordinates on the grids. Learn the meaning of different equations and practice plotting coordinates to visualize the functions.

Download Presentation

Please find below an Image/Link to download the presentation.
The content on the website is provided AS IS for your information and personal use only. It may not be sold, licensed, or shared on other websites without obtaining consent from the author. If you encounter any issues during the download, it is possible that the publisher has removed the file from their server.
You are allowed to download the files provided on this website for personal or commercial use, subject to the condition that they are used lawfully. All files are the property of their respective owners.
The content on the website is provided AS IS for your information and personal use only. It may not be sold, licensed, or shared on other websites without obtaining consent from the author.
E N D
Presentation Transcript
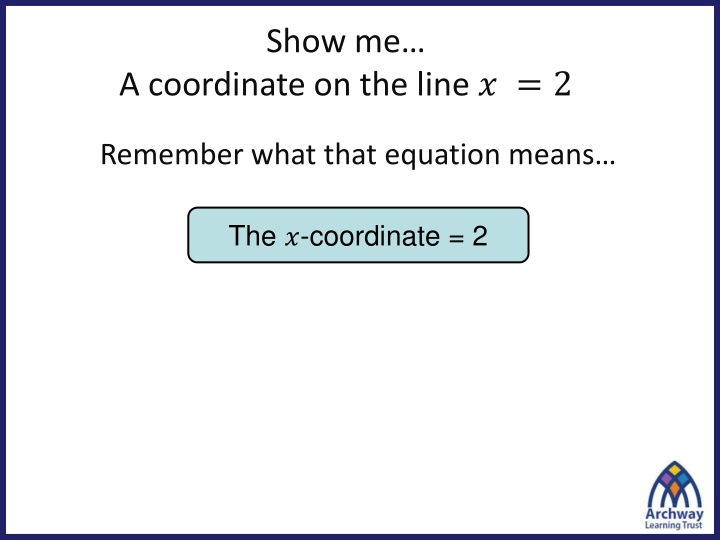
Show me A coordinate on the line ? = 2 Remember what that equation means The ?-coordinate = 2
Show me A coordinate on the line y = 4 Remember what that equation means The ?-coordinate = -4
Show me A coordinate on the line ? + ? = 6 What do you think it means? The ?-coordinate + the ?-coordinate = 6
Show me A coordinate on the line ? + ? = 6 What do you think it means? The ?-coordinate + the ?-coordinate = 6
Show me A coordinate on the line ? + ? = 6 Choose three coordinates from around the room and plot them on your grid.
Show me A coordinate on the line ? + ? = 6
Show me A coordinate on the line y = 2x What do you think it means? The ?-coordinate = double the ?-coordinate
Show me A coordinate on the line y = 2x Choose three coordinates from around the room and plot them on your grid.
Show me A coordinate on the line y = x + 3 What do you think this equation means? The ?-coordinate = the ?-coordinate + 3
Show me A coordinate on the line y = x + 3 Choose three coordinates from around the room and plot them on your grid.
Show me A coordinate on the line y = 2x + 3 Choose three of your own coordinates and plot them on the grid.
Plotting graphs of linear functions Instead of just picking random coordinates to draw a line, we can find coordinates that obey the function by constructing a table of values. Suppose we want to plot points that obey the function y = 2x + 5 We can use a table as follows. Substitute the values of x to find the value of y. x 3 2 1 0 1 2 3 1 1 3 5 7 9 11 y ( 3, 1) ( 2, 1) ( 1, 3) (0, 5) (1, 7) (2, 9) (3, 11)
Plotting graphs of linear functions For example, y to draw a graph of y = 2x + 5: 1) Complete a table of values: x y 3 1 2 1 1 3 0 5 1 7 2 9 3 y = 2x + 5 11 2) Plot the points on a coordinate grid. 3) Draw a line through the points. x 4) Label the line. 5) Check that other points on the line fit the rule.
Using a calculator To draw a graph of y = 2x + 5: 1) Complete a table of values: Goes up in 1 s x y 3 1 2 1 1 3 0 5 1 7 2 9 3 11 Type in 3 Type in -3
Question 1: Draw a set of axes from -3 to 3 on the x-axis, and from -5 to 10 on the y axis. a) b) c) Fill in the table without a calculator for each equation Check your answers are correct using the table function on the calculator. Draw a graph for each equation on the same set of axes. y = 2x + 1 y = 2x + 2 y = 2x + 3 x y 3 2 1 0 1 2 3 y = 2x + 1 y = 2x + 2 x y 3 2 1 0 1 2 3 y = 2x + 3 x y 3 2 1 0 1 2 3
Question 2: Draw a set of axes from -3 to 3 on the x-axis, and from -10 to 10 on the y axis. a) b) c) Fill in the table without a calculator for each equation Check your answers are correct using the table function on the calculator. Draw a graph for each equation on the same set of axes. y = x - 1 y = 2x - 1 y = 3x -1 x y 3 2 1 0 1 2 3 y = x - 1 y = 2x - 1 x y 3 2 1 0 1 2 3 y = 3x -1 x y 3 2 1 0 1 2 3
Question 1 10 y The three lines are parallel 5 On your whiteboards: Show me an equation of another line that is parallel to these lines. x 5 10 10 5 5 10
Question 2 The three lines cross at the same point on the y-axis. They have the same y-intercept On your whiteboards: Show me another equation that has the same y-intercept
Question 2 Which equation gives the steepest line? Can you write down an equation of a steeper line?
Graphsnaps These diagrams show bits of graphs Try and work out the equation of the lines given this information


