Plotting Linear Functions with Tables
Learn how to plot linear functions by constructing tables of values and finding coordinates that satisfy the given functions. Explore examples such as y = 2x + 5 and practice plotting points, drawing lines, and understanding equations through tables and graphs.

Download Presentation

Please find below an Image/Link to download the presentation.
The content on the website is provided AS IS for your information and personal use only. It may not be sold, licensed, or shared on other websites without obtaining consent from the author.If you encounter any issues during the download, it is possible that the publisher has removed the file from their server.
You are allowed to download the files provided on this website for personal or commercial use, subject to the condition that they are used lawfully. All files are the property of their respective owners.
The content on the website is provided AS IS for your information and personal use only. It may not be sold, licensed, or shared on other websites without obtaining consent from the author.
E N D
Presentation Transcript
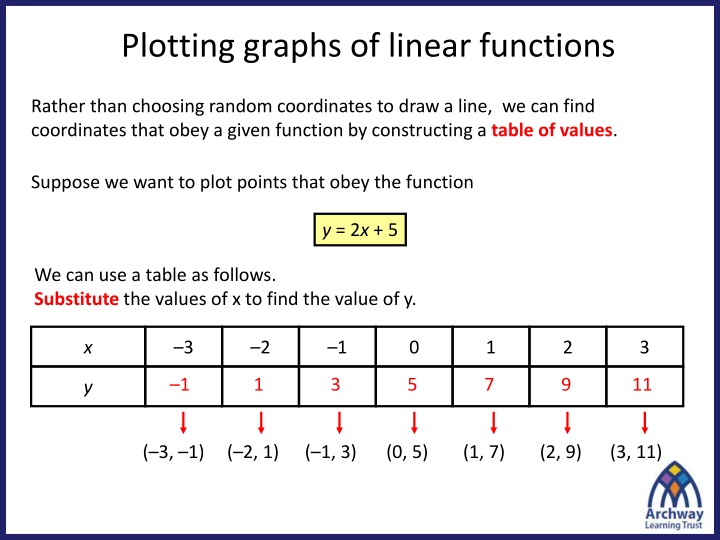
Plotting graphs of linear functions Rather than choosing random coordinates to draw a line, we can find coordinates that obey a given function by constructing a table of values. Suppose we want to plot points that obey the function y = 2x + 5 We can use a table as follows. Substitute the values of x to find the value of y. x 3 2 1 0 1 2 3 1 1 3 5 7 9 11 y ( 3, 1) ( 2, 1) ( 1, 3) (0, 5) (1, 7) (2, 9) (3, 11)
Plotting graphs of linear functions For example, y to draw a graph of y = 2x + 5: 1) Complete a table of values: x y 3 1 2 1 1 3 0 5 1 7 2 9 3 y = 2x + 5 11 2) Plot the points on a coordinate grid. 3) Draw a line through the points. x 4) Label the line.
1. Fill in the table for each equation. y , equals , 2 x , plus , 1 y , equals , 4 , plus , x x , plus , y , equals , 4 y , equals , 3 , , 2 x Draw four sets of axes from -3 to 3 on the x-axis, and from -5 to 10 on the y-axis. Plot the sets of coordinates from the tables on separate grids and join to make straight lines. ? = 2? + 1 x y 3 2 1 0 1 2 3 x y 3 2 1 0 1 2 3 ? = 4 + ? x y 3 2 1 0 1 2 3 ? + ? = 4 x y 3 2 1 0 1 2 3 ? = 3 2? 2. on the y-axis. Plot the sets of coordinates from the tables on separate grids and join to make straight lines. Draw four sets of axes from -3 to 3 on the x-axis, and from -5 to 10
Using a calculator To draw a graph of y = 2x + 5: 1) Complete a table of values: Goes up in 1 s x y 3 1 2 1 1 3 0 5 1 7 2 9 3 11 Type in 3 Type in -3
3. Fill the tables using the calculator TABLE function. y , equals 3 x , plus 4 y , equals , 4 x plus 4 y , equals 4 minus 5 x All three tables contain the coordinate ( 0 , 4 ). Why is that? Write another equation that would go through the coordinate ( 0 , 4 ). Check that is works by using the TABLE function. ? = 3? + 4 x y 1 0 1 2 3 4 5 x y 4 3 1 0 1 2 ? = 4? + 4 x y -4 2 0 2 4 6 8 ? = 4 5? 4. All three tables contain the coordinate ( 0 , 4 ). Why is that? 5. Check that is works by using the TABLE function. Write another equation that would go through the coordinate ( 0 , 4 ).
6. Why is it not possible to use the TABLE function to find coordinates for the equation ? + ? = 6? How can you manipulate the equation in order to use the TABLE function? Use the TABLE function to fill in the table below. Describe your steps. x y 0 1 2 3 Use the TABLE function to find coordinates for the function ? = ?2+ 4. 7. x y 1 0 1 2 3 4 5 Draw a set of axes and plot the graph. What do you notice?