Pomorskie Region 2014-2020 Competitiveness & EU Cohesion Insights
Explore the Pomorskie Region's focus on competitiveness in the 2014-2020 period through annual conferences and operational programs. Compare Pomorskie to Poland and the EU in terms of population, GDP, employment rates, and more. Dive into the EU Cohesion Policy's impact on Pomorskie, with a detailed look at financial allocations and program characteristics.

Download Presentation

Please find below an Image/Link to download the presentation.
The content on the website is provided AS IS for your information and personal use only. It may not be sold, licensed, or shared on other websites without obtaining consent from the author. If you encounter any issues during the download, it is possible that the publisher has removed the file from their server.
You are allowed to download the files provided on this website for personal or commercial use, subject to the condition that they are used lawfully. All files are the property of their respective owners.
The content on the website is provided AS IS for your information and personal use only. It may not be sold, licensed, or shared on other websites without obtaining consent from the author.
E N D
Presentation Transcript
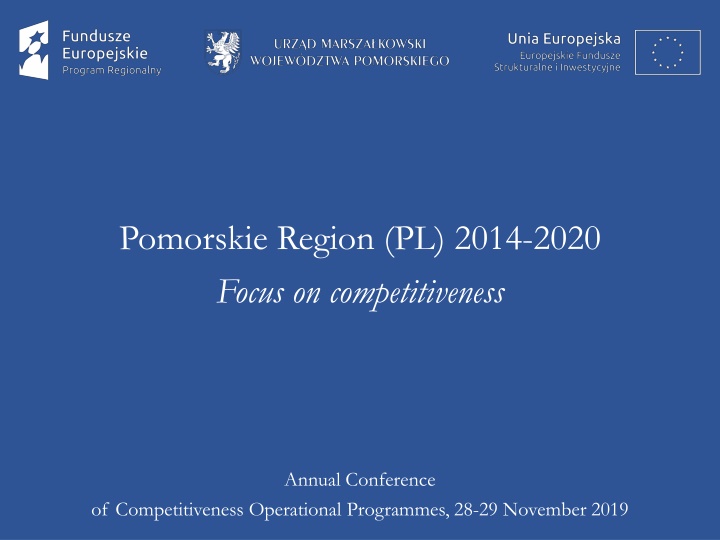
Pomorskie Region (PL) 2014-2020 Focus on competitiveness Annual Conference of Competitiveness Operational Programmes, 28-29 November 2019
Pomorskie compared to Poland 1 Population (PL=100) Natural (population) increase Net migration GDP (PL = 100) GDP per capita GVA per employee Exports per capita 6.0% 1st place 3rd place 5.8% 5th place 4th place 2nd place SMEs per capita 4th place 4th place Employment rate (20-64) Source: Central Statistical Office of Poland
Pomorskie compared to the EU 2 Pomorskie (EU=100) Indicator 2005 Last available GDP per capita (PPS) 50,2% 66% (2016) 2020 CURRENT STATUS Selected EUROPE 2020 objectives TARGET EU-28 PL EU-28 PL Pomorskie Employment rate (2018) 75% 71% 73,1% 72,2% 73,6% R&D as % of GDP (2016) 3% 1.7% 2,04% 0,96% 1,14% Renewable energy as % of energy consumption (2016) 20% 15% 17,0% 11.3% 26,4% GDP per capita in EU regions (EU-28=100), 2016 Source: Central Statistical Office of Poland, Eurostat
3 EU Cohesion Policy 2014-2020 in Poland Pomorskie ROP 2014-2020 Infrastructure & Environment Smart Growth Knowledge Education Development Digital Poland East Poland Technical Assistance Remaining 15 ROP Pomorskie ROP 2.43% 35.66% 38.26% 40,69% 11.21% 0.91% TOTAL: 76,87 bln EUR 2.60% 6.10% 2.83%
Pomorskie ROP 2014-2020 financial table 4 EU allocation m EUR 139.9 174.6 119.6 68.7 225.5 114.3 105.0 159.0 357.2 215.0 120.9 65.2 524.6 (28%) 1 340.2 (72%) 1 864.8 Priority Axis ITI FIs % 7.5 9.5 6.4 3.7 12.1 6.1 5.6 8.5 19.2 11.5 6.5 3.5 28.1 71.9 100.0 1. Knowledge Commercialisation 2. Enterprises 3. Education 4. Vocational Education 5. Employment 6. Integration 7. Health 8. Conversion 9. Mobility 10. Energy 11. Environment 12. Technical Assistance 0 35.7 48.5 17% 7.9 0 0 0 0 0 0 0 41.5 24.4 6.9 41.3 74.4 62.9 16.5 0 40.8 0 0 0 0 0 ESF 65.8 193.4 259.3 ERDF TOTAL 141.5 141.5
Pomorskie ROP 2014-2020 characteristics 5 pressure on ESF-ERDF synergy (e.g. integrated projects in the field of urban revitalisation and vocational education) strong support for partner projects (mostly in ESF co-funded Axes, but also in other PAs, mainly Conversion, Knowledge Commercialisation and Environment) broad openness for Financial Instruments (PAs: Knowledge Commercialisation, Enterprises, Conversion and Energy) territorial instruments (ITI as well as instrument dedicated to non-metropolitan urban areas) negotiation-led (contractual) approach applied to urban revitalisation, vocational training, territorial instruments, smart specialisations intensive use of evaluation one of the highest share in Polish OPs for evaluation
ROP progress per Fund 6 2,000 100% Million 1,800 85,4% 1,600 100% 1,400 90,5% 1,200 1,000 800 35,5% 34,6% 600 100% 32,3% 31,0% 72,7% 400 43,6% 43,8% 200 1685 899 786 0 ROP ESF Payments ERDF Allocation Contracts Certification
PA 1 Commercialisation of knowledge 7 200 135,5% Million 180 144,6% 160 100% Smart 140 Specialisations: 7,8% of ROP 100% 120 100 58,5% 80 50,6% 60 40 100% 94,2% 94,2% 10,5% 9,7% 11,7% 20 12,5% 47 43 0,7% 1,1% 4 0 PA1 1a 1b Allocation Applications Contracts Payments Certification
PA 1 Commercialisation of knowledge 8 0% 20% 40% 60% 80% 100% (PI 1b) Number of enterprises receiving support (CI 1) (PI 1b) 35 69 46 (PI 1b) Number of enterprises receiving grants (CI 2) (PI 1b) 29 14 27 (PI 1b) (PI 1b) Private investment matching public support to enterprises (grants) (CI 6) 1 522 604 11 643 477 153 268 362 * Change of target value proposed (PI 1b) Number of enterprises cooperating with research institutions (CI 26) (CI 26)** (PI 1b) Number of enterprises cooperating with research institutions 0 16 64 **Remove of the indicator is proposed (PI 1a) Number of research units with increased R&D budgets (PI 1a) 0 4 2 * Change of target value proposed (PI 1a) Number of researchers working in improved research infrastructure facilities (CI 25) (PI 1a) 0 22 2 * Change of target value proposed (PI 1a) Private investment matching public support in innovation or R&D projects (CI 27) R&D projects (CI 27) (PI 1a) Private investment matching public support in innovation or 247 017 17 585 245 4 001 108 * Change of target value proposed Current value Estimated value (contracts) Missing to 2023 target Exceeded value
PA 2 Enterprises 9 200 127,0% Millions 180 160 100% 165,9% 140 79,2% 120 100 100% 98,9% 80 32,2% 54,6% 37,7% 60 64,5% 100% 69,5% 40 40,2% 20 283 287 1,3% 1,5% 6,8% 6,1% 3 1 0 PA2 3a 3b 3c Allocation Applications Contracts Payments Certification
PA 2 Enterprises 10 0% 20% 40% 60% 80% 100% (PI 3c) Number of enterprises receiving support (CI 1) (PI 3c) 1 509 780 1 411 * Change of target value proposed (PI 3c) Number of enterprises receiving grants (CI 2) (PI 3c) 136 4 150 (PI 3c) Number of enterprises receiving financial support other than grants (CI 3) grants (CI 3) (PI 3c) (PI 3c) Number of enterprises receiving financial support other than 1 375 625 1 560 * Change of target value proposed (PI 3c) Private investment matching public support to enterprises (grants) (CI 6) 17 739 683 50 327 871 13 143 620 * Change of target value proposed (PI 3c) Number of enterprises supported to introduce new to the market products (CI 28) (PI 3c) 46 14 109 (PI 3c) (PI 3c) Number of enterprises supported to introduce new to the firm products (CI 29) 139 * Change of target value proposed 174 287 (PI 3b) Number of enterprises receiving support (CI 1) (PI 3b) 306 194 1 300 (PI 3b) Number of enterprises which introduced organisational or process-related optimizations (PI 3b) 100 100 (PI 3a) Number of enterprises receiving support (CI 1) (PI 3a) 215 635 350 (PI 3a) Area of primed investment areas (PI 3a) 16 54 (PI 3a) Number of enterprises supported with specialist advice (PI 3a) 600 * Change of target value proposed (PI 3a) Number of advanced servies (new or improved) offered by business environment intitutions (PI 3a) 19 11 * Change of target value proposed Current value Estimated value (contracts) Missing to 2023 target Exceeded value (contracts)
11 FI in ROPs 2014-2020: R&I&SMEs mEUR 200 SMEs R&I + OP Smart Growth equity, guarantees (1,4 bln EUR) 180 160 140 120 100 80 60 40 20 0
Financial Instruments in Pomorskie 2014-2020 12 ERDF 85% (mEUR) SB 10% (mEUR) Priority Axis PA Commercialisation of Knowledge loans & equity Enterprises loans & guarantees Conversion 1 35,32 4,15 1b 30.09.2016 ~ 93 mEUR 2 47,99 5,65 3c Return to the EIB homepage 8 16,70 1,96 9b loans 09.12.2016 ~ 64,8 mEUR 28,22 3,32 4c Energy 10 loans 13,02 1,53 4a 16,62 141,25 7,6% of ROP TOTAL 157,87
FI in Pomorskie 2014-2020. State of play 13 ERDF as of 3Q2019 No. disbursted contracted IP Financial Product of Financial Intermedaries No. of Final Recipients 9 mEUR mEUR Innovation loan 1 5,51 3,49 by the end of 2019: 1 1b Equity 0 0 0 0 TOTAL 1 5,51 3,49 9 Microloan Business devel. loan Investment loan Profiled loan 6 35,87 35,74 1 515 3c multiplier: 5 Guarantees 2 6,31 (31,56) 5,67 (28,35) 87 TOTAL (10) 9 42,18 41,41 1 602 3c: by the end of 2019 100% will be certified (4th payment request is being processed) 3c: 93% ERDF as eligible expenditure 1b: 12% ERDF as eligible expenditure
Projects in PI 1b Showcase 14 Zak ad badawczo-wdro eniowy yk s.c. 0,6 m EUR Grupa Geofusion sp. z o. o. 1,1 m EUR PSS 3: eco-efficiency in energy and building sector PSS 1: offshore, harbours, logistics innovative platform to be used in the seabed exploration detection and utilization of dangerous submerged and military loads (unexploaded bombs/grenades) new type of concrete mixture with increased strength for the price comparable to the existing products DuoRS Sp. z o.o. 0,2 m EUR Eventplug sp. z o. o. SKA 1,1 m EUR PSS 2: interactive technologies, IoT PSS 4: medical technologies application for drivers VIAPOL communicating with smartphone and vehicle s on-board units + dynamic LED road signs (LED boards located along newly built highways increased roads capacity, working time optimalization for drivers) diagnostic tests used to diagnose cancer detection of genetic mutations associated with cancer predispositions directly at the doctor's office no need to send samples to the lab
15 2021-2027: what have we done so far? 1. Assumptions for the Partnership Agreement were drafted (v1) 2. Working groups discussing individual Policy Objectives are appointed 3. Investment needs and the financial gap in the selected areas of development policy is being estimated 4. Operational Programmes were to be drafted this year 5. POM: Regional Development Strategy 2030 is being drafted EU T&C Partnership Agreement POMORSKIE 2030 POM ROP 2021-2027
Thank You Magdalena Pronobis | m.pronobis@pomorskie.eu Financial Instruments Unit | Department of Regional and Spatial Development Marshall Office of the Pomorskie Region (PL) | www.pomorskie.eu
 2014-2020")