Population Pyramids: Analysis and Predictions
Explore population pyramids to predict future impacts of growth and decline. Learn to read and analyze these pyramids, focusing on key factors such as age structure, gender distribution, birth and death rates, and life expectancy. Discover how governments use population pyramids for decision-making in areas like education, jobs, and transportation.

Download Presentation

Please find below an Image/Link to download the presentation.
The content on the website is provided AS IS for your information and personal use only. It may not be sold, licensed, or shared on other websites without obtaining consent from the author. If you encounter any issues during the download, it is possible that the publisher has removed the file from their server.
You are allowed to download the files provided on this website for personal or commercial use, subject to the condition that they are used lawfully. All files are the property of their respective owners.
The content on the website is provided AS IS for your information and personal use only. It may not be sold, licensed, or shared on other websites without obtaining consent from the author.
E N D
Presentation Transcript
Chapter 8 Population Pyramids
Learning Outcomes By the end of the class you should be able to: Read a population pyramid. Analyse a population pyramid and make predictions about the future impacts of population growth and decline.
Look out for these Key Words during the lesson: Population Pyramid Age Structure Sex/Gender Structure Birth Rate Death Rate Static Expanding
Homework for next class Textbook: Revise pp. 140-141 Revise Population Pyramid sheet
Population Pyramid of Ireland With your partner what can you tell me about this population pyramid???? Male Female
Video clip ..\..\Video clips\Population Pyramids - The basics.mp4
Studying Population pyramids Show gender and age profile of population Provide information on: Percentage of males and females How many people in each age group Birth rates and death rates Life expectancy of population from structure How developed a country is from shape Percentage of population dependent Exam hint: You need to know what population pyramids are and what they show.
Population Pyramid Gender Number of Females in this age range Number of Males in this age range Scale Age Range
Advantages of Population Pyramids Easy and Clear to analyse. More detail of the age and gender of a country s population. Governments can use the Population Pyramid to make decisions to meet the populations needs. Education Jobs Transport
Population Pyramids We are now going to look at 3 different countries, Brazil, Germany and Ireland. For each country we are going to examine 1) Birth rates 2) Death rates 3) Life expectancy
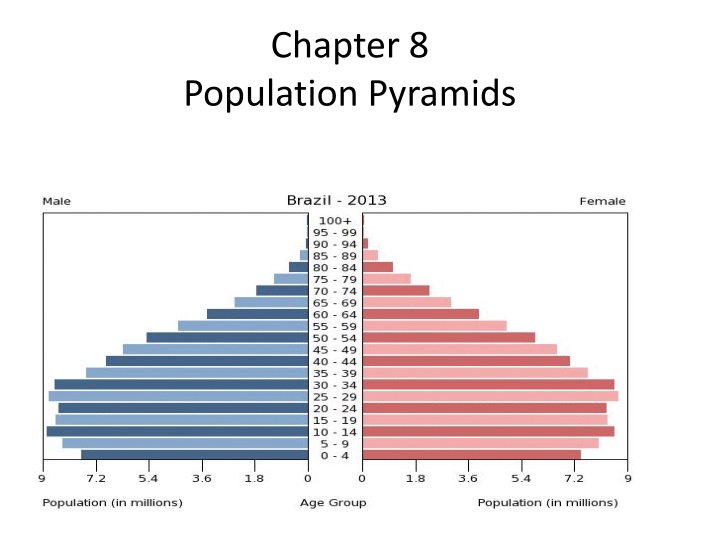
Brazil Look at: Birth Rate Death Rate High Birth Rate Wide base Young age Structure High Death rate Narrow peak
Population pyramid: Brazil 1) Birth rates 2) Death rates 3) Life expectancy 0-4 band birth rates high, rapidly growing population Top narrow death rates high Narrow peak few people survive into old age Factors: Lack of clean water Lack of health services Low living standards Factors: Women: traditional role Lack of family planning High infant mortality Children care for parents when old Factors: Healthcare not available Harsh working conditions Lack of sanitation
Germany Low and declining birth rate Narrow base Older population structure Low death rate Broader peak.
Population pyramid: Germany 1) Birth rates 2) Death rates 3) Life expectancy Narrow base birth rates low, static or declining Wide at middle and towards top death rates low Wide peak high life expectancy Factors: Women have careers Practise family planning Infant mortality low Children don t work Children not expected to care for old parents Factors: High standard of living Excellent health service Good sanitation and water Fewer diseases Factors: Access to healthcare Good services for elderly High living standards
Population pyramid: Ireland 4.5 million in 2010 Developed country Population growing slowly
Population pyramid: Ireland Birth rates Death rates Life expectancy Slight increase at base but birth rate is low Wide at middle and top low death rate Wide peak high life expectancy Factors: Low infant mortality Access to family planning Role of women in society Women have children later in life Factors: Access to healthcare Vaccinations High standard of living Educated about healthy living Clean water and sanitation Factors: Good care for elderly Good health services High standard of living
1. What are the main differences between the population structures shown in photographs. X Y 2. Can you explain these differences using a graph above? B A
Homework Mr. Cadogan has just received a population pyramid and cannot remember how to read it. In a letter, explain to him how to interpret a population pyramid. Please include the basic parts of a pyramid (Age and Gender) and the difference in a developing (triangle) and developed (diamond) shaped pyramids.
Can you. Read a population pyramid. Analyse a population pyramid and make predictions about the future impacts of population growth and decline.