Poverty Estimates in Tajikistan Using TajStat Household Budget Survey
Tajikistan, one of the poorest countries in Europe and Central Asia, conducted a Household Budget Survey to estimate poverty levels for the years 2012/2013. The survey data provided valuable insights into household compositions, economic activities, expenditures, and consumption patterns. Despite some limitations in data coverage and methodology, efforts were made to improve the survey for more accurate poverty measurement in the future.

Download Presentation

Please find below an Image/Link to download the presentation.
The content on the website is provided AS IS for your information and personal use only. It may not be sold, licensed, or shared on other websites without obtaining consent from the author.If you encounter any issues during the download, it is possible that the publisher has removed the file from their server.
You are allowed to download the files provided on this website for personal or commercial use, subject to the condition that they are used lawfully. All files are the property of their respective owners.
The content on the website is provided AS IS for your information and personal use only. It may not be sold, licensed, or shared on other websites without obtaining consent from the author.
E N D
Presentation Transcript
TAJIKISTAN 2012/2013 POVERTY ESTIMATES USING THE TAJSTAT HOUSEHOLD BUDGET SURVEY TajStat World Bank
Introduction Tajikistan is one of the poorest countries in the Europe and Central Asian region with GDP per capita of US $ 2,247 in PPP terms in 2012. The country has grown very fast during the 2000s and was not strongly affected by the 2008-2009 world recession. Tajikistan s performance in poverty reduction during 2007-2009 positions it in the top decile of the world performers (Wald Bank, 2014). However, due to the lack of suitable surveys, Tajikistan has not been able to report poverty estimates based on actual microdata for the past five years, instead the country has relied on poverty-growth elasticity estimates to project poverty since 2009. The shortcomings of such approach are many, not the least the fact that is assumes a distributional neutral growth, which implies in a constant relationship between growth and poverty reduction over time. The recent crises (i.e. 2006 food crisis; Global Financial Crisis; Eurozone crisis; 2009 food crisis) have shown that this is not case, as many countries presented growth and poverty dynamics that were not aligned.
Data-page 1 Since January 2009, Household budget survey (HBS) is conducted quarterly by the Tajik Statistical Agency (TajStat) each year with the coverage of 3,000 households. The sample is designed to be representative on a national, urban/rural and regional level in each quarter. The HBS survey instruments consist of three types of household questionnaires: the annual household questionnaire that includes questionnaire forms 4, 5, 6, 7; the quarterly questionnaire on household supply and consumption of agricultural produce, fodder and fuel that includes questionnaire forms 2, 3; the diary for household income and expenditures supported by monthly journal that includes questionnaire forms 1, 8; The following information is collected in the survey: household composition and demographic characteristics; economic activity in both agricultural and non-agricultural sectors; housing and infrastructure; expenditures and consumption on food and nonfood items; income; household supply and consumption of agricultural produce, fodder and fuel, livestock, and land plot use.
Data-page 2 The present analysis of HBS survey data has focused on the development of a suitable methodology to carry out the very first round of HBS-based poverty estimates in Tajikistan, and considerable effort was placed on checking data quality issues. Unlike the data from the earlier years of HBS, it is worth noting that 2012/2013 HBS data represent a viable alternative for the poverty measurement in Tajikistan. However, while the information available in the HBS questionnaire allows constructing a reliable welfare indicator, margins of improvement are large. The comprehensiveness of the consumption aggregate is substantially limited by the absence of important components such as housing, durable goods, other non-food expenditures, as well as improvements on household identification In addition, the HBS survey can be significantly enhanced by updating the sampling frame to 2010 census and changing the current paneling scheme to rotational panel, as well as improve the field work protocols and supervision
Methodology The proposed welfare aggregate for the HBS survey is defined as the aggregate of food expenditures adjusted by the ratio between consumed and purchased quantities of food Due to lack of suitable data, expenditures on housing and on selected durables are not included in the welfare aggregate. and of non-food expenditures. The absolute poverty line for the HBS survey is defined by the Cost of Basic Needs method. the CBN method, the total poverty line is the sum of two components: food poverty line and allowance for non-food consumption. According to For estimating the food poverty line, set the average kilocalorie requirement (AKR) per person per day and estimate the minimum cost of one kilocalorie by choosing the bottom three national per capita expenditure deciles. at 2,250 kilocalories For estimating the allowance for basic non-food expenditures, we identify households whose actual food expenditures are approximately equal to the food poverty line.
Preliminary All Number presented in this note are still subject to revision
PRELIMINARY POVERTY RESULTS BASED ON THE HBS Using the available HBS last four quarters, as the living wage in the country is not set, so the World Bank recommended the use of the food poverty line of 105.14 somoni per person per month, and the upper poverty line (subsistence) 145.55 somoni per person per month. In 2012/2013 period, 14% of the population could not afford the food poverty line while 35.6% fell below the upper poverty line.
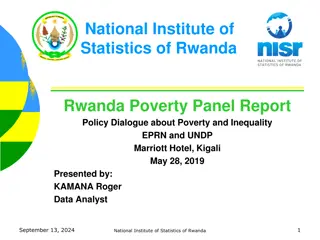
Poverty headcount Rate by Territory Upper poverty line = 145.55 somoni/person/month 60 The regional variation is substantial. The level of poverty is the highest in GBAO at 52% and the lowest in Dushanbe at 19%. 51.53 45.69 50 39.24 39.17 35.64 40 28.52 30 % 23.93 19.16 20 10 0 GBAO RRP Khatlon Sogd Dushanbe Urban Rural Tajikistan
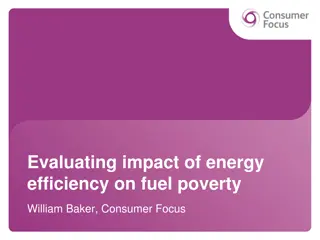
Poverty headcount Rate by Territory Food poverty line = 105.14 somoni/person/month 60 50 40 30 % 24.03 19.74 16.68 16.4 20 14.28 9.98 7.08 10 5.13 0 GBAO RRP Khatlon Sogd Dushanbe Urban Rural Tajikistan GBAO RRP Khatlon Sogd Dushanbe Urban Rural Tajikistan
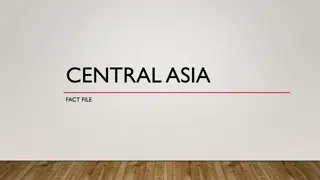
PRELIMINARY VULNERABLE AND MIDDLE CLASS RESULTS BASED ON THE HBS Share of Middle Class 45 41.22 Figure shows the corresponding shares for the middle class. Slightly more than two fifth of Tajikistan population are in the vulnerable group while one fifth of population falls into middle class categories. 40 35.64 35 30 25 % 20 15 11.72 11.42 10 5 0 poor vulnerable middle class low middle class high
All data tables refer to the latest HBS data available in 2012/2013 period over the following time frame: quarter 3, quarter 4 of 2012 and quarter 1, quarter 2 of 2013. Table 1: Overall Poverty Poverty Squared Poverty Gap Poverty Gap Headcount Rate 2012/2013 2012/2013 2012/2013 Upper poverty line = 145.55 somoni/person/month Urban 28.5 6.5 2.1 Rural 39.2 10.1 3.7 Total 35.6 8.9 3.2 Food poverty line = 105.14 somoni/person/month Urban 10.0 1.6 0.4 Rural 16.4 3.3 1.0 Total 14.3 2.8 0.8
Table 2: Distribution of Poor in Urban and Rural Areas Poverty Headcount Rate Distribution of the Poor Distribution of Population 2012/2013 2012/2013 2012/2013 Upper poverty line = 145.55 somoni/person/month Urban Rural 28.5 39.2 26.5 73.5 33.2 66.8 Total 35.6 100.0 100.0 Food poverty line = 105.14 somoni/person/month Urban Rural 10.0 16.4 23.2 76.8 33.2 66.8 Total 14.3 100.0 100.0
Table 3: Headcount Ratio by Subnational Regions Poverty Headcount Rate Distribution of the Poor Distribution of Population 2012/2013 2012/2013 2012/2013 Upper poverty line = 145.55 somoni/person/month Region/Oblast Dushanbe Sogd KHatlon DRS GBAO Total 19.2 23.9 39.2 45.7 51.5 35.6 5.9 17.3 34.7 30.1 12.1 100.0 11.0 25.7 31.5 23.5 8.4 100.0 Food poverty line = 105.14 somoni/person/month Region/Oblast Dushanbe Sogd KHatlon DRS GBAO Total 5.1 7.1 16.7 19.7 24.0 14.3 4.0 12.8 36.8 32.5 14.1 100.0 11.0 25.7 31.5 23.5 8.4 100.0
Table 4: Poverty Gap Measure by Subnational Regions Contribution to Overall Poverty Distribution of Population Poverty gap 2012/2013 2012/2013 2012/2013 Upper poverty line = 145.55 somoni/person/month Region/Oblast Dushanbe Sogd KHatlon DRS GBAO 3.8 4.9 10.2 12.0 14.4 4.7 14.2 35.9 31.7 13.5 11.0 25.7 31.5 23.5 8.4 Total 8.9 100.0 100.0
FINAL REMARKS Regarding the implementation of the improvement plan of the HBS the following activities are already under way: Data entry system. The redesign of a new data entry system for the HBS has already started. A beta version of the proposed system has been crated and is starting to be tested with TajStat team. The new platform will be based on CSPro. Sample Frame update. In the December/2013 World Bank mission it was agreed that TajStat will lead the redesign of the sample frame and that the World Bank will provide international experts to revise the proposed work. Revised questionnaire. A redesigned questionnaire has been suggested and piloted in Dushanbe in June/2013. A larger scale instrument test with 500 households has also gone to the field between July/2013 and August/2013. Once the data is cleaned the team will start to analyze the results. Data dissemination and reporting. In December/2013 the World Bank mission organized training in Dushanbe to TajStat staff on international standards and tools for microdata documentation, archiving and dissemination. The TajStat with World Bank will continue to accompany this process