"Explore a comprehensive analysis of power monitoring at Pantnagar Supersite Compound on June 23-24, 2011. The summary includes voltage trends, frequency analysis, histograms, dips and swells data, transient recordings, flicker analysis, harmonics data, and more. Discover detailed insights and visual representations of power data for informed decision-making."
Please find below an Image/Link to download the presentation.
The content on the website is provided AS IS for your information and personal use only. It may not be sold, licensed, or shared on other websites without obtaining consent from the author. If you encounter any issues during the download, it is possible that the publisher has removed the file from their server.
You are allowed to download the files provided on this website for personal or commercial use, subject to the condition that they are used lawfully. All files are the property of their respective owners.
The content on the website is provided AS IS for your information and personal use only. It may not be sold, licensed, or shared on other websites without obtaining consent from the author.
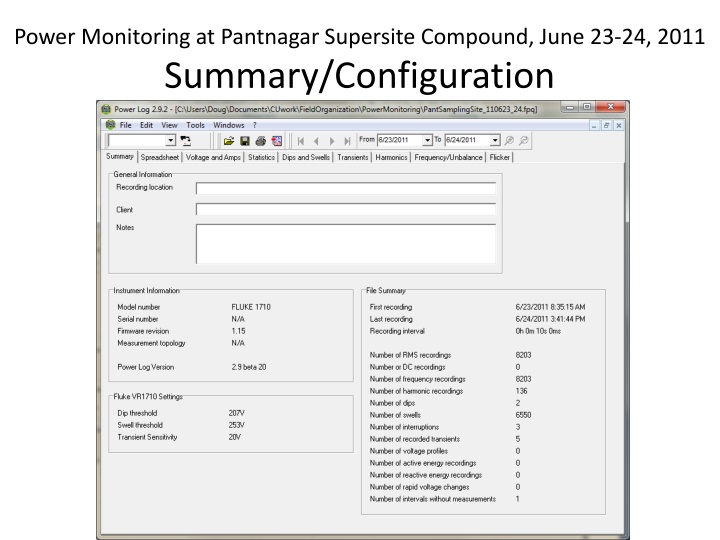
Dips and Swells (10s) Mostly <100ms dips (some 100-1000 ms) MEANINGLESS b/c dip/swell thresholds set to 207/253V
5 TRANSIENTS recorded in ~1 day (transient sensitivity set to 20V) Transient sensitivity from 2 V to 20 V. To detect transients, a typical waveform is first determined through sampling. This waveform will change over time as the input waveform changes. An envelope around the typical waveform is created based on the sensitivity setting. If any point of a sampled waveform falls outside of the envelope, the waveform is recorded as a transient. Therefore, although the voltage varied over a large range, with numerous dips, generally the high frequency waveform appears pretty clean.
Flicker Instantaneous Flicker PF5, short-termflicker (Pst) and long-term flicker (Plt). Short-term flicker is a value measured over 10-minute intervals and long-term flicker is measured over two hours. A value of 1.0 indicates it is likely to notice a light bulb flickering
Harmonics Bar Graph (3rd, 5th, 7th order as % of voltage of primary frequency 50Hz; average/min/max)
Harmonics Time series THD(blue), 3rd(red), 5th(grn), 7th(blk) order as % of voltage of primary frequency 50Hz)


 Voltage")
 Voltage")
 Voltage")
")


