Predicting Vocational Rehabilitation Outcomes for Disability Policy
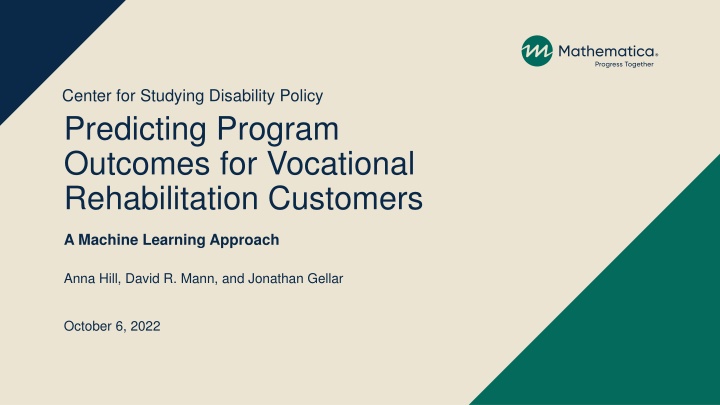
Explore how a machine learning approach is used to predict program outcomes for Vocational Rehabilitation customers with disabilities. Learn about tailored employment-focused supports, identifying characteristics correlated with outcomes, and existing knowledge about VR customers. Data from 490,255 cases is analyzed to increase the likelihood of positive outcomes for customers.
Download Presentation

Please find below an Image/Link to download the presentation.
The content on the website is provided AS IS for your information and personal use only. It may not be sold, licensed, or shared on other websites without obtaining consent from the author. If you encounter any issues during the download, it is possible that the publisher has removed the file from their server.
You are allowed to download the files provided on this website for personal or commercial use, subject to the condition that they are used lawfully. All files are the property of their respective owners.
The content on the website is provided AS IS for your information and personal use only. It may not be sold, licensed, or shared on other websites without obtaining consent from the author.
E N D
Presentation Transcript
Center for Studying Disability Policy Predicting Program Outcomes for Vocational Rehabilitation Customers A Machine Learning Approach Anna Hill, David R. Mann, and Jonathan Gellar October 6, 2022
VR offers tailored employment-focused supports for people with disabilities VR program is administered at the state level with federal funding Participation is voluntary and customers must apply to receive services VR service milestones: Service receipt Eligibility determination VR programexit IPE Application ~ 2/3 of eligible customers sign an IPE ~ 1/3 of eligible customers exit with employment Center for Studying Disability Policy 2
Identifying customers likely to exit with or without employment early in the VR service path The majority of VR customers exit the program without employment - Use a rigorous data-driven method to identify previously undocumented groupings of customer characteristics correlated with VR outcomes - Generate information that can be used to increase the likelihood of good outcomes for groups of customers who might otherwise exit without employment Center for Studying Disability Policy 3
What do we already know about VR customers and their outcomes? VR customers - Most applicants want to work, but experience employment-related barriers Correlates of VR outcomes - Individual customer characteristics correlated with poor VR outcomes include low SES, non-White race, and lack of prior work experience - Other external factors include agency and counselor characteristics and local labor market conditions Center for Studying Disability Policy 4
Data and analysis sample RSA-911 Case Service Report - Individual case-level administrative data - Analysis sample oVR customers who applied and were eligible for services in FFY 2014 and exited the program no later than June 2019 oSample includes 490,255 cases from application year 2014 (~87% of all applicants from that year) Center for Studying Disability Policy 5
Predicting VR outcomes Outcome groups - Customers who exited without having a signed IPE (35%) - Customers who exited after receiving services but without employment (30%) - Customers who exited with employment after receiving services (36%) Predictors (measured at application) - Demographic - Disabling condition - Socioeconomic - Employment Additional analysis includes VR service categories - Explore the role of services in the relationships identified between customer characteristics and outcomes Center for Studying Disability Policy 6
Machine learning approaches Explore the predictive relationship between data collected at application and VR outcomes Instead of specifying a theoretical relationship between variables, ML allows us to consider all possible combinations of predictors Classification and regression trees (CART) - Recursive partitioning approach that segments the data into groups using predictor variables Random forest (RF) - Averages predictions across many regression trees in resulting in more robust predictions Center for Studying Disability Policy 7
Regression tree: groups of customer characteristics measured at application and VR outcomes All eligible 2014 applicants Center for Studying Disability Policy 8
100% of sample 36% 30% 35% Earns at least $53 per week at application N Y 84% of sample 38% 32% 30% Has a developmental disability Y N 69% of sample 40% 31% 29% 14% of sample 26% 35% 40% N Y Y N Has a learning disability Is 18 or younger 15% of sample 29% 35% 36% N Y Is 18 or younger 54% of sample 43% 30% 26% 6% of sample 35% 29% 36% 9% of sample 25% 39% 37% 10% of sample 27% 32% 41% 4% of sample 22% 42% 36% 16% of sample 25% 17% 58% 9
Regression tree: groups of customer characteristics and service categories and VR outcomes Eligible 2014 applicants who had an IPE Center for Studying Disability Policy 10
100% 54% N Y Earns at least $47 per week at application 19% 77% 81% 49% N Y Restoration services Y N Employment services 8% 60% 41% 41% Y N Employment services Y N Restoration services 4% 49% N Y Training services 31% 32% 4% 46% 1% 66% 11% 88% 10% 47% 40% 62% 4% 74% 11
Conclusions We find several key groups with low earnings at application that could benefit from more specialized case management: - Customers with neither a developmental nor a learning disability - Customers aged 18 and under with a learning disability - Employment and restoration services are associated with improved outcomes among low earners Early interventions for these groups might improve their outcomes Considerations for agencies and counselors: - Why might customers who do not have developmental or learning disabilities be more likely than others to exit without having signed an IPE? - Dedicated staff or processes for evaluating needs/goals and developing service plan Center for Studying Disability Policy 12
Funding for this study was provided by the Research and Training Center on Disability Statistics and Demographics at the University of New Hampshire, which is funded by the National Institute for Disability, Independent Living, and Rehabilitation Research in the Administration for Community Living at the U.S. Department of Health and Human Services (DHHS) under cooperative agreement 9ORTGE0001. The contents do not necessarily represent the policy of DHHS, and the reader should not assume endorsement by the federal government (EDGAR, 75.620 (b)). Center for Studying Disability Policy 13
Citation Hill, A., Mann, D. R., & Gellar, J. (2022). Predicting program outcomes for vocational rehabilitation customers: A machine learning approach. Journal of Vocational Rehabilitation, (Preprint), 1-15. Center for Studying Disability Policy
For more information David Mann DMann@Mathematica-mpr.com Twitter: @DavidRMann Anna Hill AHill@Mathematica-mpr.com Jonathan Gellar JGellar@Mathematica-mpr.com Center for Studying Disability Policy 15
Analysis sample characteristics Characteristic Age 14 18 years 19 24 years 25 34 years 35 44 years 45 years or more Female Hispanic Non-white race Employment Unemployed Employed competitive Employed supported employment Not employed in school Weekly earnings Weekly hours worked Education Less than high school education Completed high school Some post-secondary education Proportion SE Characteristic Disabling condition Developmental Learning disability Medical or systemic Mental health Neurological Substance abuse Trauma Source of public support Other source SSDI SSI State general assistance TANF VA disability payments Workers compensation Outcome Exit VR after IPE, employed Exit VR after IPE, not employed Exit VR with no IPE Proportion SE 19.2% 17.1% 17.3% 15.3% 31.0% 43.5% 12.3% 30.9% 0.1% 0.1% 0.1% 0.1% 0.1% 0.1% 0.0% 0.1% 17.1% 16.9% 12.5% 25.5% 2.2% 5.5% 7.6% 0.1% 0.1% 0.0% 0.1% 0.0% 0.0% 0.0% 8.3% 16.2% 18.5% 4.4% 2.9% 0.6% 0.7% 0.0% 0.1% 0.1% 0.0% 0.0% 0.0% 0.0% 66.5% 15.4% 0.1% 0.1% 2.2% 0.0% 15.9% $19.0 5.1 0.1% $0.06 0.02 34.9% 0.1% 33.4% 0.1% 29.6% 0.1% 37.1% 29.5% 0.1% 0.1% 35.6% 0.1% 16
Methods Classification and regression trees (CART) - Recursive partitioning approach that segments the data into groups using predictor variables o The most important predictor variable partitions the sample into groups with the most disparate possible average outcomes o Other predictor variables split the groups into increasingly smaller groups in order of importance o Once the process is complete, the partitioning sequence can be visualized as a decision tree o CART has the advantage of a presentation-friendly output, but can be sensitive to small changes in the data 17
Methods Random Forest (RF) - RF addresses the sensitivity of CART by estimating many regression trees using randomly chosen subsets of the analysis sample for each tree and randomly chosen subsets of predictors at each node of each tree - It averages predictions across all of the trees in the forest resulting in more robust predictions - We use an RF with 500 trees and cross-validation to choose modeling details like the number of predictors used at each node and a stopping rule - The main drawback of RF is difficulty in presenting interpretable results it is not useful to present multiple trees o We present results from the RF model in two ways 1. Variable importance. Variables that most often appear at the top of trees in the forest are given higher importance than those that often appear lower 2. Partial dependence (marginal effect). We report the difference in expected outcomes across fixed values of the predictor variables 18

