Predicting YouTube Popularity Using Latent Social Approach
Explore how a latent social approach can predict YouTube popularity by analyzing request patterns, network structures, and transaction records. Learn about the challenges and goals of using predictive caching in social networks.

Download Presentation

Please find below an Image/Link to download the presentation.
The content on the website is provided AS IS for your information and personal use only. It may not be sold, licensed, or shared on other websites without obtaining consent from the author. If you encounter any issues during the download, it is possible that the publisher has removed the file from their server.
You are allowed to download the files provided on this website for personal or commercial use, subject to the condition that they are used lawfully. All files are the property of their respective owners.
The content on the website is provided AS IS for your information and personal use only. It may not be sold, licensed, or shared on other websites without obtaining consent from the author.
E N D
Presentation Transcript
A Latent Social Approach to YouTube Popularity Prediction Amandianeze Nwana Prof. Salman Avestimehr Prof. Tsuhan Chen
Statistics Up to 60% of all videos are watched through YouTube 1 9.85North American Traffic2 Other YouTube 90.15 YouTube Traffic2 27 Mobile 73 PCs and Laptops 1 YouTube Traffic Characterization: A View From the Edge; P Gill, Arlitt, Li, Mahanti 2 http://www.sandvine.com
Statistics: Campus View The most popular videos globally typically only account for about 1% of the videos viewed on campus daily 1 Correlation coefficient between global popularity and local popularity is too low 2 Number of Requests 1 >1 1 YouTube Traffic Characterization: A View From the Edge; P Gill, Arlitt, Li, Mahanti 2 http://www.sandvine.com
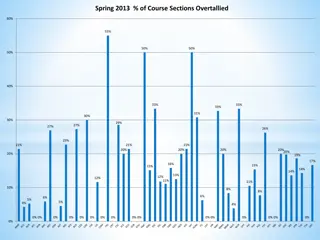
Typical Request Patterns Romnesia speech goes viral Sports Highlights Music Videos Source: UMass Amherst YouTube trace dataset (1 week)
Main Idea lol .did you see that video?
Main Idea Can a record of the transactions reveal information about the network structure and graph? Can the network structure and a record of the transactions predict future trends?
Traditional Caching Requests Requests Gateway Router YouTube Server Local Network Response Cache Response
Predictive (Social) Caching Requests Transactions Gateway Router Cache Transactions Latent Network
Challenge Transactions Gateway Router Latent Network
Estimating the Social Network Mathematical Epidemiology Given population ?, and infectious disease ?, ??(?)- Subset of population that is currently susceptible to ? at time ? ??(?)- Subset of population that is currently infected by ? at time ?
Mathematical Epidemiology Compartmental Models The interaction between these subsets an be modeled in the following way: ? ?:Once individuals get infected they remain infected and infectious forever ? ? ?:Individuals can get reinfected by the same virus
Diffusion Model 2 Stages Decide who gets infected by whom independently Stage 1 Decide the time of infection (observed symptoms) Stage 2
Latent Social Network Inference 2 8 1 4 3 6 10
Inference Steps Occurs in two stages: Stage 1: Given the transaction fit the inter-arrivals to a power law Stage 2: Given the estimated power law, and the transactions, find the Influence matrix that maximizes the likelihood of the observed transactions Maximum Likelihood Estimation
back to caching We now have the social graph over the network of users We need a video relevance function to assign relevance scores to videos Rank the videos according to relevance scores and store the top K videos in the cache
Video Relevance Calculate a temporal score(v) proportional to its frequency, and decaying in the time since last arrival. ????? (? ??) social score(v) is calculated according to the sum of the probabilities of new infections ? ? ? ???? (? ?? ?) Combine temporal score with social score.
Results Comparison % Improve Inter-Arrival/CRF 11.6 Combined/Inter-Arrrival 13.2 Table 1: Percentage Improvements of algorithms using all users Fig. 1: Average Hitrate for all approaches over different cache sizes Fig.2: Cache Size comparison between purely social and baseline using all users
Results Connected Users Comparison % Improve Temporal/CRF 15.6 Combined/CRF 21.1 Table 2: Percentage Improvements of algorithms without isolated nodes Fig. 3: Average Hitrate for all approaches over different cache sizes without isolated nodes Fig.4: Cache Size comparison between purely social and baseline without isolated nodes
Future Directions Explore other epidemic models On the fly update of nodes and edges Graph clustering into different communities and influence groups User recommendations using the social graph Object detection and tagging via twitter


 Caching")