Predictors of Readmission or Death Among Heart Failure Patients in New Jersey
This study examined predictors of readmission or death among heart failure patients in New Jersey using data from a statewide cardiovascular disease database. Factors such as age, gender, race, and comorbidities like hypertension and coronary heart disease were identified as significant predictors. The research highlights the importance of assessing risk factors to improve outcomes for heart failure patients.

Download Presentation

Please find below an Image/Link to download the presentation.
The content on the website is provided AS IS for your information and personal use only. It may not be sold, licensed, or shared on other websites without obtaining consent from the author.If you encounter any issues during the download, it is possible that the publisher has removed the file from their server.
You are allowed to download the files provided on this website for personal or commercial use, subject to the condition that they are used lawfully. All files are the property of their respective owners.
The content on the website is provided AS IS for your information and personal use only. It may not be sold, licensed, or shared on other websites without obtaining consent from the author.
E N D
Presentation Transcript
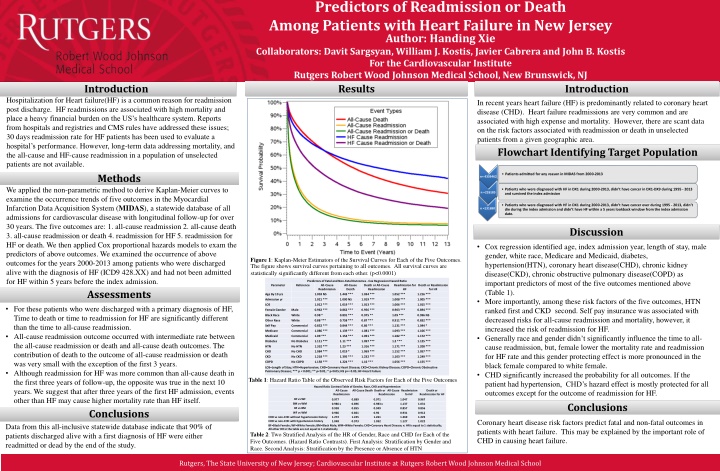
Predictors of Readmission or Death Among Patients with Heart Failure in New Jersey Author: Handing Xie Collaborators: Davit Sargsyan, William J. Kostis, Javier Cabrera and John B. Kostis For the Cardiovascular Institute Rutgers Robert Wood Johnson Medical School, New Brunswick, NJ Results Introduction Introduction Hospitalization for Heart failure(HF) is a common reason for readmission post discharge. HF readmissions are associated with high mortality and place a heavy financial burden on the US s healthcare system. Reports from hospitals and registries and CMS rules have addressed these issues; 30 days readmission rate for HF patients has been used to evaluate a hospital s performance. However, long-term data addressing mortality, and the all-cause and HF-cause readmission in a population of unselected patients are not available. In recent years heart failure (HF) is predominantly related to coronary heart disease (CHD). Heart failure readmissions are very common and are associated with high expense and mortality. However, there are scant data on the risk factors associated with readmission or death in unselected patients from a given geographic area. Flowchart Identifying Target Population Methods Patients admitted for any reason in MIDAS from 2000-2013 n= 4359462 We applied the non-parametric method to derive Kaplan-Meier curves to examine the occurrence trends of five outcomes in the Myocardial Infarction Data Acquisition System (MIDAS), a statewide database of all admissions for cardiovascular disease with longitudinal follow-up for over 30 years. The five outcomes are: 1. all-cause readmission 2. all-cause death 3. all-cause readmission or death 4. readmission for HF 5. readmission for HF or death. We then applied Cox proportional hazards models to exam the predictors of above outcomes. We examined the occurrence of above outcomes for the years 2000-2013 among patients who were discharged alive with the diagnosis of HF (ICD9 428.XX) and had not been admitted for HF within 5 years before the index admission. Assessments Patients who were diagnosed with HF in DX1 during 2000-2013, didn t have cancer in DX1-DX9 during 1995 - 2013 and survived the index admission n =226185 Patients who were diagnosed with HF in DX1 during 2000-2013, didn t have cancer ever during 1995 - 2013, didn t die during the index admission and didn t have HF within a 5 years lookback window from the index admission date. n =131690 Discussion Cox regression identified age, index admission year, length of stay, male gender, white race, Medicare and Medicaid, diabetes, hypertension(HTN), coronary heart disease(CHD), chronic kidney disease(CKD), chronic obstructive pulmonary disease(COPD) as important predictors of most of the five outcomes mentioned above (Table 1). More importantly, among these risk factors of the five outcomes, HTN ranked first and CKD second. Self pay insurance was associated with decreased risks for all-cause readmission and mortality, however, it increased the risk of readmission for HF. Generally race and gender didn t significantly influence the time to all- cause readmission, but, female lower the mortality rate and readmission for HF rate and this gender protecting effect is more pronounced in the black female compared to white female. CHD significantly increased the probability for all outcomes. If the patient had hypertension, CHD s hazard effect is mostly protected for all outcomes except for the outcome of readmission for HF. Figure 1: Kaplan-Meier Estimators of the Survival Curves for Each of the Five Outcomes. The figure shows survival curves pertaining to all outcomes. All survival curves are statistically significantly different from each other. (p<0.0001) Predictors of Fatal and Non-Fatal Outcomes - Cox Regression Hazard Ratio Reference All-Cause Readmission Death Parameter All-Cause Death or All-Cause Readmission Readmission for HF Death or Readmission for HF Age By 10 yrs 1.003 NS 1.443 *** 1.034 *** 1.052 *** 1.216 *** Admission yr 1.021 *** 1.000 NS 1.019 *** 1.008 *** 1.005 *** LOS 1.012 *** 1.019 *** 1.013 *** 1.006 *** 1.015 *** For these patients who were discharged with a primary diagnosis of HF, Time to death or time to readmission for HF are significantly different than the time to all-cause readmission. All-cause readmission outcome occurred with intermediate rate between the all-cause readmission or death and all-cause death outcomes. The contribution of death to the outcome of all-cause readmission or death was very small with the exception of the first 3 years. Although readmission for HF was more common than all-cause death in the first three years of follow-up, the opposite was true in the next 10 years. We suggest that after three years of the first HF admission, events other than HF may cause higher mortality rate than HF itself. Female Gender Male 0.962 *** 0.862 *** 0.956 *** 0.903 *** 0.894 *** Black Race White 0.98 * 0.891 *** 0.975 ** 1.09 *** 0.996 NS Other Race White 0.88 *** 0.758 *** 0.87 *** 0.911 *** 0.832 *** Self Pay Commercial 0.852 *** 0.844 *** 0.86 *** 1.131 *** 1.044 * Medicare Commercial 1.086 *** 1.139 *** 1.081 *** 1.093 *** 1.106 *** Medicaid Commercial 1.09 *** 1.154 *** 1.091 *** 1.182 *** 1.172 *** Diabetes No Diabetes 1.111 *** 1.11 *** 1.097 *** 1.2 *** 1.125 *** HTN No HTN 1.332 *** 1.23 *** 1.316 *** 1.171 *** 1.208 *** CHD No CHD 1.084 *** 1.019 * 1.069 *** 1.152 *** 1.057 *** CKD No CKD 1.218 *** 1.395 *** 1.232 *** 1.103 *** 1.249 *** COPD No COPD 1.158 *** 1.224 *** 1.16 *** 1.056 *** 1.155 *** LOS=Length of Stay; HTN=Hypertension; CHD=Coronary Heart Disease; CKD=Chronic Kidney Disease; COPD=Chronic Obstructive Pulmonary Disease; *** p < 0.001; ** p<0.01; * p<0.05; NS p>= 0.05; HF=Heart Failure Table 1: Hazard Ratio Table of the Observed Risk Factors for Each of the Five Outcomes Hazard Ratio Contrast Table of Gender, Race, CHD and Hypertension All-Cause Readmission All-Cause Death Death or All-Cause Readmission for HF Death or Readmission Readmission for HF BF vs WF BM vs WM BF vs BM WF vs WM 0.977 0.986 x 0.958 0.966 1.272 1.048 0.889 0.896 0.855 0.861 1.245 0.973 0.971 0.983 x 0.949 0.96 1.261 1.032 1.047 1.137 0.857 0.931 1.269 1.127 0.967 1.031 0.856 0.912 1.229 1.022 Conclusions Conclusions CHD vs non-CHD without hypertension history CHD vs non-CHD with hypertension history BF=Black Female; WF=White Female; BM=Black Male; WM=White Female; CHD=Coronary Heart Disease; x: HR is equal to 1 statistically; All other HR in the table are not equal to 1 statistically Table 2: Two Stratified Analysis of the HR of Gender, Race and CHD for Each of the Five Outcomes. (Hazard Ratio Contrasts). First Analysis: Stratification by Gender and Race. Second Analysis: Stratification by the Presence or Absence of HTN Coronary heart disease risk factors predict fatal and non-fatal outcomes in patients with heart failure. This may be explained by the important role of CHD in causing heart failure. Data from this all-inclusive statewide database indicate that 90% of patients discharged alive with a first diagnosis of HF were either readmitted or dead by the end of the study. Rutgers, The State University of New Jersey; Cardiovascular Institute at Rutgers Robert Wood Johnson Medical School
Adult patients admitted for any reason in MIDAS from 2000-2013 n= 4359462 Adult patients who were diagnosed with HF in DX1 during 2000-2013, didn t have cancer in DX1- DX9 during 1995 - 2013 and survived the index admission n =226185 Adult patients who were diagnosed with HF in DX1 during 2000-2013, didn t have cancer ever during 1995 - 2013, didn t die during the index admission and didn t have HF within a 5 years lookback window from the index admission date. n =131690
Predictors of Fatal and Non-Fatal Outcomes - Cox Regression Hazard Ratio All-Cause Readmission Parameter Reference All-Cause Death Death or All-Cause Readmission Readmission for HF Death or Readmission for HF Age By 10 yrs 1.003 NS 1.443 *** 1.034 *** 1.052 *** 1.216 *** Admission yr 1.021 *** 1.000 NS 1.019 *** 1.008 *** 1.005 *** LOS 1.012 *** 1.019 *** 1.013 *** 1.006 *** 1.015 *** Female Gender Male 0.962 *** 0.862 *** 0.956 *** 0.903 *** 0.894 *** Black Race White 0.98 * 0.891 *** 0.975 ** 1.09 *** 0.996 NS Other Race White 0.88 *** 0.758 *** 0.87 *** 0.911 *** 0.832 *** Self Pay Commercial 0.852 *** 0.844 *** 0.86 *** 1.131 *** 1.044 * Medicare Commercial 1.086 *** 1.139 *** 1.081 *** 1.093 *** 1.106 *** Medicaid Commercial 1.09 *** 1.154 *** 1.091 *** 1.182 *** 1.172 *** Diabetes No Diabetes 1.111 *** 1.11 *** 1.097 *** 1.2 *** 1.125 *** HTN No HTN 1.332 *** 1.23 *** 1.316 *** 1.171 *** 1.208 *** CHD No CHD 1.084 *** 1.019 * 1.069 *** 1.152 *** 1.057 *** CKD No CKD 1.218 *** 1.395 *** 1.232 *** 1.103 *** 1.249 *** COPD No COPD 1.158 *** 1.224 *** 1.16 *** 1.056 *** 1.155 *** LOS=Length of Stay; HTN=Hypertension; CHD=Coronary Heart Disease; CKD=Chronic Kidney Disease; COPD=Chronic Obstructive Pulmonary Disease; *** p < 0.001; ** p<0.01; * p<0.05; NS p>= 0.05; HF=Heart Failure
Hazard Ratio Contrast Table of Gender, Race, CHD and Hypertension All-Cause Readmission All-Cause Death Death or All- Cause Readmission Readmission for HF Death or Readmission for HF BF vs WF 0.977 0.889 0.971 1.047 0.967 BM vs WM 0.986 0.896 0.983 1.137 1.031 BF vs BM 0.958 0.855 0.949 0.857 0.856 WF vs WM 0.966 1.272 1.048 0.861 1.245 0.973 0.96 1.261 1.032 0.931 1.269 1.127 0.912 1.229 1.022 CHD vs non-CHD without hypertension history CHD vs non-CHD with hypertension history BF=Black Female; WF=White Female; BM=Black Male; WM=White Female; CHD=Coronary Heart Disease