Explore the preliminary cohort reconstruction results for Sacramento fall Chinook, evaluating the draft cohort reconstruction for potential accuracy improvements over current methodologies. The analysis includes cohort progression through time, observations on hatchery returns, in-river spawners, and more. Discover insights on impacts of fisheries, maturation rates, and abundance levels. Uncover the potential escapement estimates and ocean abundance for various run years.
Please find below an Image/Link to download the presentation.
The content on the website is provided AS IS for your information and personal use only. It may not be sold, licensed, or shared on other websites without obtaining consent from the author. If you encounter any issues during the download, it is possible that the publisher has removed the file from their server.
You are allowed to download the files provided on this website for personal or commercial use, subject to the condition that they are used lawfully. All files are the property of their respective owners.
The content on the website is provided AS IS for your information and personal use only. It may not be sold, licensed, or shared on other websites without obtaining consent from the author.
E N D
Presentation Transcript
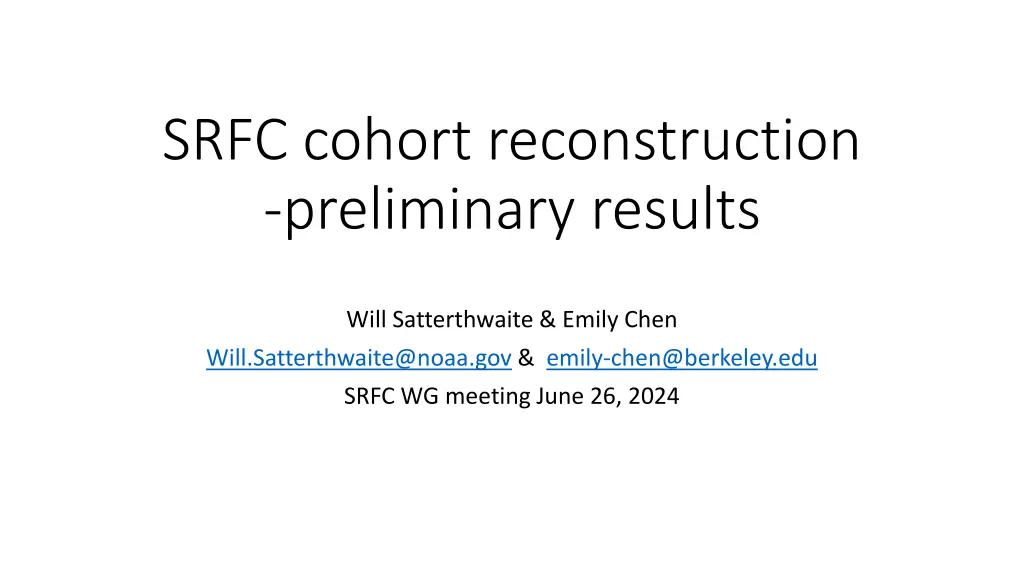
SRFC cohort reconstruction -preliminary results Will Satterthwaite & Emily Chen Will.Satterthwaite@noaa.gov & emily-chen@berkeley.edu SRFC WG meeting June 26, 2024
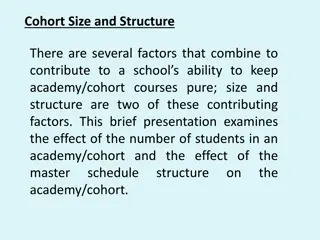
Council Guidance: (2) Task the workgroup with evaluating the draft cohort reconstruction that is underway for Sacramento fall Chinook and determine if it will provide substantial improvement and accuracy over current forecasting and modeling methodologies.
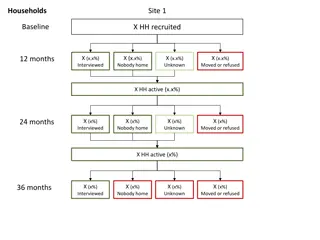
Cohort analysis Cohort progression through time Things we can observe or sample age-specific escapement In-river spawners Hatchery returns In-river harvest Total abundance maturation S3 S4 S2 N1 N2 N3 N4 mortality F2 F3 F4 M1 M2 M3 M4
Cohort Reconstruction Things we can observe or sample Hatchery returns In-river spawners In-river harvest Ocean fishery landed harvest of tagged fish maturation S3 S4 S2 Total abundance N1 N2 N3 N4 Things we want to know Impacts of fisheries on stocks of interest Maturation rates Early life survival Subadult natural mortality rates typically assume F2 F3 F4 mortality M1 M2 M3 M4
Cohort Reconstruction Hatchery fish Brood Year 1998-2016 CWT recovered from spawning grounds, hatcheries, in-river fisheries, ocean fisheries Natural-origin fish Brood Year 2008-2016 Unmarked scales aged from spawning grounds by CDFW Age composition adjusted using Kimura Chikuni bias correction Natural-origin spawning age-composition Unmarked natural-origin fisha = Unmarked fisha - unmarked hatchery fisha Fishery impact assumed to be the same as hatchery cohorts
Preliminary cohort reconstruction outputs SI (postseason estimate) Potential escapement absent* fishing Potential escapement fully unfished Sept 1 ocean abundance Run Year 2011 2012 2013 2014 2015 2016 2017 2018 2019 207 628 869 551 255 205 137 220 507 199 492 665 451 206 172 110 174 481 317 878 1422 828 376 256 184 292 983 205 516 746 592 299 212 132 205 540 Abundances are in thousands *absent fishing means no fishing in current year, but still reflects reductions resulting from ocean fisheries in previous years
SI over-estimates potential escapement Potential escapement absent* fishing SI (postseason estimate) Run Year 2011 2012 2013 2014 2015 2016 2017 2018 2019 Comparison 104% 128% 131% 122% 124% 119% 125% 126% 105% 207 628 869 551 255 205 137 220 507 199 492 665 451 206 172 110 174 481 More unlikely to achieve target escapement
SI over-estimates potential escapement Potential escapement absent* fishing SI (postseason estimate) SI vs Potential Escapement SI includes age-3 fish that wouldn t have matured SI ocean harvest component south of Point Arena includes other natural-origin stocks (e.g., San Joaquin fall, CCC, CVSC, SONCC) This confounds expansion used for ocean- harvest north of Point Arena Run Year 2011 2012 2013 2014 2015 2016 2017 2018 2019 Comparison 104% 128% 131% 122% 124% 119% 125% 126% 105% 207 628 869 551 255 205 137 220 507 199 492 665 451 206 172 110 174 481
SI under-estimates ocean abundance SI (postseason estimate) Sept 1 ocean abundance Comparison 317 878 1422 828 376 256 184 292 983 Run Year 2011 2012 2013 2014 2015 2016 2017 2018 2019 207 628 869 551 255 205 137 220 507 65% 71% 61% 67% 68% 80% 74% 75% 52% Could lead to setting in-season quotas too low? Implications for SRKW abundance threshold
SI under-estimates ocean abundance SI (postseason estimate) Sept 1 ocean abundance Comparison 317 878 1422 828 376 256 184 292 983 SI vs Sept 1 abundance Sept 1 includes fish that ultimately become natural mortalities SI doesn t include non-landed mortalities Run Year 2011 2012 2013 2014 2015 2016 2017 2018 2019 207 628 869 551 255 205 137 220 507 65% 71% 61% 67% 68% 80% 74% 75% 52% Could lead to setting in-season quotas too low? Implications for SRKW abundance threshold
Fishing mortality accumulates across years Potential escapement absent* fishing Potential escapement fully unfished Run Year 2011 2012 2013 2014 2015 2016 2017 2018 2019 Comparison 199 492 665 451 206 172 110 174 481 205 516 746 592 299 212 132 205 540 97% 95% 89% 76% 69% 81% 83% 85% 89% Single-year Exploitation Rate calculations may not be capturing the full picture
SI-derived Ocean Harvest Rate vs age-specific impact rates Ocean Harvest is greater than impact of primary ages harvested (age 3 and 4)
Age 2 maturation rates Increasing in hatchery populations but not natural-origin, although time series for natural- origin is shorter
Age 3 maturation rates Lots of year-to-year variation in age-3 maturation rates. Also an increase in age- 3 hatchery maturation rates over time
Outmigration production (NO) and survival (HO) corr = 0.84 Year-1 survival (i.e., from release to age-2) of hatchery cohorts (gold) and productivity (age-2 recruits per spawner) of natural-origin broods (blue). *note different axis (points in years not directly comparable)


 and survival (HO)")