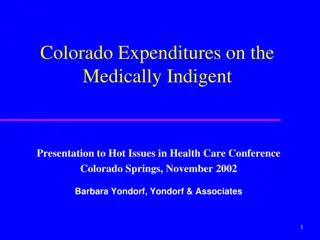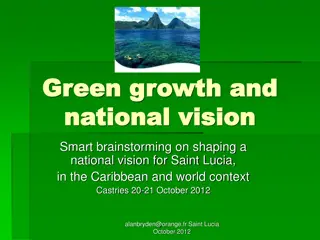
Preliminary Findings on St. Lucia's Economic Data
This data analysis presents insights into the economic landscape of St. Lucia, including sectoral contributions to GDP, employment trends, FDI inflows, and sectoral credit distribution. The findings cover key sectors like tourism, real estate, agriculture, manufacturing, and more.

Download Presentation

Please find below an Image/Link to download the presentation.
The content on the website is provided AS IS for your information and personal use only. It may not be sold, licensed, or shared on other websites without obtaining consent from the author. If you encounter any issues during the download, it is possible that the publisher has removed the file from their server.
You are allowed to download the files provided on this website for personal or commercial use, subject to the condition that they are used lawfully. All files are the property of their respective owners.
The content on the website is provided AS IS for your information and personal use only. It may not be sold, licensed, or shared on other websites without obtaining consent from the author.
E N D
Presentation Transcript
Economic Data for St Lucia: Preliminary Findings Ramesh Chaitoo Ramesh Chaitoo International Trade Consultant rnmsts@yahoo.ca fc185627@skynet.be Background Seminar for Senior Officials re Discussion of a Services Policy for St Lucia Castries, February 20, 2012
Sectoral Composition of GDP St Lucia, 2010 Main Sectors Contribution: % OF GDP 2010 Tourism, 10.69% Real Estate, 13.30% Agriculture, 3.49% Manufacturing, 6.17% Wholesale & Retail, 9.17% Construction, 10.73% Banking & Insurance, 7.51% Communications, 6.86%
Sectoral Composition of GDP St Lucia, 2009 Main Sectors Contribution: % OF GDP 2009 Tourism, 11.56% Real Estate, 14.59% Agriculture, 3.80% Manufacturing, 6.30% Construction, 5.28% Wholesale & Retail, 11.30% Communications, 11.85% Banking & Insurance, 15.50%
Employment by Sector St Lucia Employment 2001 - 2008 ('000) per Sector Average 2001 - 2004 2005 2006 2007 2008 63.930 68.930 67.180 72.780 71.900 Total Employment 10.328 9.050 5.960 8.270 7.650 Agriculture 5.098 4.720 3.860 4.160 3.020 Manufacturing 5.518 7.530 8.050 8.940 7.290 Construction 553 500 760 420 600 Electricity, Gas & Water 10.105 10.030 11.540 11.210 10.870 Wholesale & Retail Trade 7.713 8.690 8.760 8.870 11.510 Hotels & Restaurants 3.968 4.170 3.340 4.370 5.180 Communications 1.188 1.600 1.860 1.090 1.660 Banking & Insurance 2.275 2.680 2.800 2.950 1.970 Real Estate
FDI Inflows St Lucia (EC$ mill) FDI Indicatiors 2004 - 2011 700 600 500 EC$ - Millions 400 300 FDI Inflows 200 100 0 2004 2005 2006 2007 2008 2009 2010 2011 proj
FDI stock in St Lucia (EC$ mill.) FDI Stock 2004 - 2011 3500 3000 2500 EC$ - Millions 2000 1500 FDI stock 1000 500 0 2004 2005 2006 2007 2008 2009 2010 2011 pr
Sectoral Distribution of Credit St Lucia, 2009 CONSTRUCTION, 8.20% MANUFACTURING, 1.80% TOURISM, 19.40% AGRICULTURE, 1% DISTRIBUTIVE TRADE, 7.70% OTHER, 14.10% PERSONAL, 29.30% PROFESSIONAL, 18.60%
Policy Frameworks for Services? Specific Policies? ANT DOM GDA KNA SLU Tourism SVG Offshore finance, ICT Specific Incentives? ANT DOM GDA KNA SLU Tourism SVG Offshore finance, ICT 10
Export Strategies DOM Export strategy targets culture, professional, construction, wellness tourism. SLU 2004 Export Strategy - Arts & entertainment, architecture, ICT, Integrated Marketing Communications, nursing, tourism. GDA Export Strategy? tourism, business services, education, construction & engineering. Also has ICT strategy; health & wellness tourism strategy in process. SVG Export strategy still in process; ICT strategy. KNA 2006 Adaptation strategy Tourism, ICT, financial services. ANT Information void; ICT? 11
Foreign Investment Strategies Unclear regarding what governments say in terms of attracting investors. All OECS have incentives for tourism sector for many years. Some incentives for offshore financial services firms No clear image for any country like Mauritius for ICT hub, health tourism.
Health Tourism Common OECS Tourism Policy discussed in August 2011 but health tourism is not part of that agenda. Given the massive size and age structure of the US and Canadian populations, future prospects for health tourism may be the greatest of all targeted sectors But it requires focused, organized effort and significant new investment in infrastructure, standards, training, proper air links, etc. etc.
Overall Assessment of Supply Side St Lucia is really ready for exports to US & Canada in any of the targeted sectors, except perhaps, ICT. Too few players, Firms too small & not really outward oriented Very segmented markets in spite of Economic Union Standards do not meet international expectations Lack of relevant education and training failure at the basic CXC level. Training shortfall in technical areas? 14
Total Deposits in OECS Commercial Banks (EC$ 000)
THANK YOU THANK YOU RAMESH CHAITOO International Trade Consultant rnmsts@yahoo.ca fc185627@skynet.be 16


")
")

")