Presidential Preference Primaries: Historical Data and Strategic Planning Insights
Explore historical data on presidential preference primaries from 1976, 1988, and a look towards 2016. Understand voter turnout, ballot questions, precinct changes, and strategic planning insights based on established plans by County and Municipal Governments.
Download Presentation

Please find below an Image/Link to download the presentation.
The content on the website is provided AS IS for your information and personal use only. It may not be sold, licensed, or shared on other websites without obtaining consent from the author. If you encounter any issues during the download, it is possible that the publisher has removed the file from their server.
You are allowed to download the files provided on this website for personal or commercial use, subject to the condition that they are used lawfully. All files are the property of their respective owners.
The content on the website is provided AS IS for your information and personal use only. It may not be sold, licensed, or shared on other websites without obtaining consent from the author.
E N D
Presentation Transcript
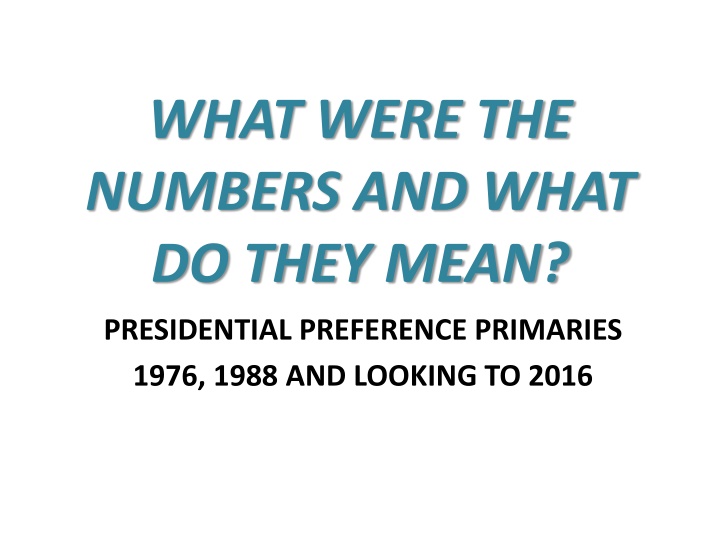
WHAT WERE THE NUMBERS AND WHAT DO THEY MEAN? PRESIDENTIAL PREFERENCE PRIMARIES 1976, 1988 AND LOOKING TO 2016
To the Counties who participated in the Presidential Preference Survey
Other Statewide Primaries Number of Voters Percentage 1988 Turnout 2000 Turnout 2012 Turnout 953,759 868,593 2,182,675 31% 18% 35%
1976 Constitutional Ballot Questions 54.17% of Reporting Counties Had Other Questions on their Ballot 45.83% 54.17% Yes No
1988 No Statewide Ballot Questions Fewer than 10% of Reporting Counties had additional Ballot questions 9.52% 90.48% Yes No
Precinct Changes Precincts from 1976 - 1988 14 19 33 16 49 Precincts from 1988 - 2015 16 18 34 15 49 Precincts from 1976 - 2015 18 11 29 20 49 Beginning number or increase in number of precincts Number remained the same Total increased and equal Number decreased Total Reporting
Number of Precincts From the 51 reporting counties 1,020 Precincts were used in 1976 1, 178 Precincts were used in 1988 1,154 Precincts projected in 2016 State wide projection is 2,726
HOW TO PLAN Review Strategic Plans established by County and Municipal Governments Strategic Plans are already researched by professionals in their respective fields Plans offer accurate projections Plans evaluate potential growth locations within the county
Planning Board Information Keep your radar up for changes made by area Planning Boards Approval of infrastructure development Schools, Fire Stations (means growth area) Approval of new housing developments, apartment complexes
BOTTOM LINE.. Planning for an election is a series of educated expectations of the future. There is no way to predict exactly how many voters will appear at any given precinct or one stop site. A counties best defense is a good offense RESEARCH and PLAN FOR MORE THAN YOU ANTICIPATE.

