Prevalence of Obesity Among US Adults by Race/Ethnicity, State & Territory, BRFSS 2021-2023
This study analyzes obesity prevalence among US adults based on self-reported weight and height by race/ethnicity, state, and territory using data collected through the BRFSS in 2021-2023. The findings show varying obesity rates across different demographics, with insights into Non-Hispanic White adults' obesity prevalence by state and territory.
Download Presentation

Please find below an Image/Link to download the presentation.
The content on the website is provided AS IS for your information and personal use only. It may not be sold, licensed, or shared on other websites without obtaining consent from the author.If you encounter any issues during the download, it is possible that the publisher has removed the file from their server.
You are allowed to download the files provided on this website for personal or commercial use, subject to the condition that they are used lawfully. All files are the property of their respective owners.
The content on the website is provided AS IS for your information and personal use only. It may not be sold, licensed, or shared on other websites without obtaining consent from the author.
E N D
Presentation Transcript
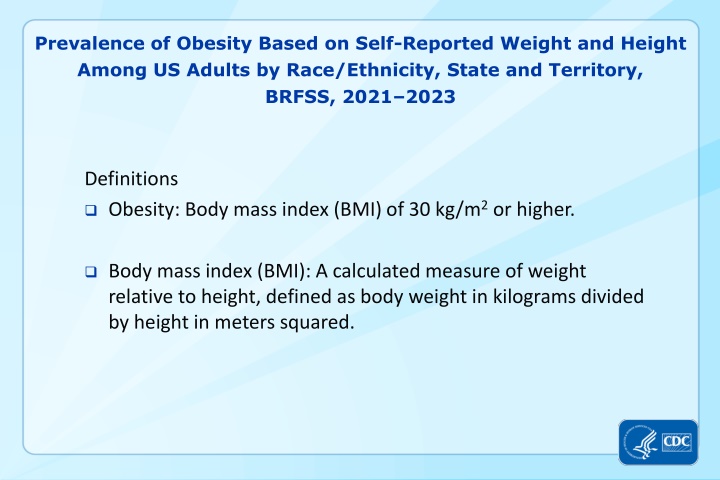
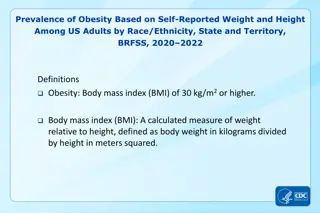
Prevalence of Obesity Based on Self-Reported Weight and Height Among US Adults by Race/Ethnicity, State and Territory, BRFSS, 2021 2023 Definitions Obesity: Body mass index (BMI) of 30 kg/m2or higher. Body mass index (BMI): A calculated measure of weight relative to height, defined as body weight in kilograms divided by height in meters squared.
Prevalence of Obesity Based on Self-Reported Weight and Height Among US Adults by Race/Ethnicity, State and Territory, BRFSS, 2021 2023 Method The data were collected through the Behavioral Risk Factor Surveillance System (BRFSS), an ongoing, state-based, telephone interview survey conducted by state health departments with assistance from CDC. Height and weight data used in the BMI calculations were self- reported. Three years of data were combined to ensure sufficient sample size.
Prevalence of Obesity Based on Self-Reported Weight and Height Among US Adults by Race/Ethnicity, State and Territory, BRFSS, 2021 2023 Exclusion Criteria Records with the following were excluded: Height: <3 feet or 8 feet Weight: <50 pounds or 650 pounds BMI: <12 kg/m2or 100 kg/m2 Pregnant women
Prevalence of Obesity Based on Self-Reported Weight and Height Among Non-Hispanic White Adults, by State and Territory, BRFSS, 2021 2023 *Sample size <50, the relative standard error (dividing the standard error by the prevalence) 30%, or no data in a specific year.
Prevalence of Obesity Based on Self-Reported Weight and Height Among Non-Hispanic White Adults, by State and Territory, BRFSS, 2021 2023 State Alabama Alaska Arizona Arkansas California Colorado Connecticut Delaware District of Columbia Florida Georgia Guam Hawaii Idaho Illinois Indiana Iowa Kansas Kentucky Louisiana Maine Maryland Massachusetts Michigan Minnesota Mississippi Missouri Prevalence 36.0 32.4 28.8 37.4 25.7 23.7 28.2 34.1 13.5 Insufficient data* 32.6 25.5 20.1 31.3 33.3 37.0 37.4 35.5 Insufficient data* 36.6 32.4 31.1 27.1 34.4 33.3 35.2 35.9 95% Confidence Interval (34.6, 37.3) (31.2, 33.6) (27.8, 29.7) (36.2, 38.6) (24.6, 26.8) (23.0, 24.5) (27.2, 29.3) (32.7, 35.6) (12.1, 15.0) Insufficient data* (31.5, 33.7) (20.1, 31.8) (18.8, 21.6) (30.4, 32.2) (31.9, 34.8) (36.3, 37.8) (36.6, 38.2) (34.8, 36.2) Insufficient data* (35.4, 37.9) (31.7, 33.2) (30.3, 32.0) (26.2, 28.0) (33.6, 35.3) (32.7, 34.0) (33.7, 36.8) (35.0, 36.9) State Montana Nebraska Nevada New Hampshire New Jersey New Mexico New York North Carolina North Dakota Ohio Oklahoma Oregon Pennsylvania Puerto Rico Rhode Island South Carolina South Dakota Tennessee Texas Utah Vermont Virgin Islands Virginia Washington West Virginia Wisconsin Wyoming Prevalence 30.0 36.3 30.9 31.7 28.1 27.9 28.7 31.8 35.3 37.2 38.2 31.3 Insufficient data* Insufficient data* 29.8 32.6 36.5 35.7 32.5 30.0 28.3 20.1 33.7 30.9 41.0 35.4 32.2 95% Confidence Interval (29.2, 30.9) (35.5, 37.1) (29.1, 32.8) (30.6, 32.7) (27.0, 29.2) (26.3, 29.5) (28.0, 29.4) (30.5, 33.2) (34.3, 36.3) (36.5, 37.9) (37.1, 39.3) (30.4, 32.3) Insufficient data* Insufficient data* (28.7, 31.0) (31.7, 33.6) (34.6, 38.5) (34.6, 36.9) (31.3, 33.8) (29.2, 30.7) (27.4, 29.3) (13.6, 28.6) (32.7, 34.7) (30.3, 31.5) (40.0, 42.0) (34.5, 36.3) (31.0, 33.4) *Sample size <50, the relative standard error (dividing the standard error by the prevalence) 30%, or no data in a specific year. Source: Behavioral Risk Factor Surveillance System, CDC.
Prevalence of Obesity Based on Self-Reported Weight and Height Among Non-Hispanic White Adults, by State and Territory, BRFSS, 2021 2023 Summary The District of Columbia had a prevalence of obesity less than 20%. Colorado, Hawaii, and Virgin Islands had a prevalence of obesity between 20% and <25%. 9 states and Guam had a prevalence of obesity between 25% and <30%. 20 states had a prevalence of obesity between 30% and <35%. 15 states had a prevalence of obesity between 35% and <40%. West Virginia had a prevalence of obesity 40% or greater.
Prevalence of Obesity Based on Self-Reported Weight and Height Among Non-Hispanic Black Adults, by State and Territory, BRFSS, 2021 2023 *Sample size <50, the relative standard error (dividing the standard error by the prevalence) 30%, or no data in a specific year.
Prevalence of Obesity Based on Self-Reported Weight and Height Among Non-Hispanic Black Adults, by State and Territory, BRFSS, 2021 2023 State Alabama Alaska Arizona Arkansas California Colorado Connecticut Delaware District of Columbia Florida Georgia Guam Hawaii Idaho Illinois Indiana Iowa Kansas Kentucky Louisiana Maine Maryland Massachusetts Michigan Minnesota Mississippi Missouri Prevalence 49.6 38.7 39.9 48.2 37.5 29.5 41.9 44.9 37.0 Insufficient data* 43.8 Insufficient data* 28.1 31.0 42.5 44.7 39.4 39.5 Insufficient data* 47.1 31.9 42.5 35.1 42.5 35.7 47.1 43.1 95% Confidence Interval (47.3, 52.0) (32.0, 46.0) (35.2, 44.7) (44.6, 51.9) (34.0, 41.1) (25.8, 33.4) (38.5, 45.4) (41.5, 48.3) (34.7, 39.5) Insufficient data* (41.8, 45.9) Insufficient data* (21.2, 36.3) (20.5, 43.9) (39.1, 46.0) (42.1, 47.4) (34.5, 44.7) (35.9, 43.2) Insufficient data* (44.9, 49.4) (23.5, 41.6) (41.0, 44.0) (31.7, 38.6) (40.0, 45.0) (32.9, 38.6) (44.9, 49.4) (40.0, 46.2) State Montana Nebraska Nevada New Hampshire New Jersey New Mexico New York North Carolina North Dakota Ohio Oklahoma Oregon Pennsylvania Puerto Rico Rhode Island South Carolina South Dakota Tennessee Texas Utah Vermont Virgin Islands Virginia Washington West Virginia Wisconsin Wyoming Prevalence 50.7 36.2 36.3 33.7 36.6 43.3 36.5 48.1 27.1 43.6 47.5 31.1 Insufficient data* Insufficient data* 38.9 45.6 31.0 47.4 43.8 29.5 25.9 35.8 46.6 36.8 42.8 48.4 Insufficient data* 95% Confidence Interval (34.5, 66.7) (31.9, 40.9) (30.9, 42.1) (23.0, 46.3) (34.0, 39.3) (33.9, 53.2) (34.7, 38.3) (45.4, 50.8) (21.0, 34.2) (41.0, 46.2) (43.5, 51.6) (24.3, 38.8) Insufficient data* Insufficient data* (33.8, 44.2) (43.6, 47.7) (20.0, 44.7) (44.2, 50.7) (40.7, 47.0) (21.5, 39.1) (18.7, 34.8) (31.1, 40.7) (44.3, 48.9) (33.6, 40.1) (36.8, 49.0) (43.6, 53.2) Insufficient data* *Sample size <50, the relative standard error (dividing the standard error by the prevalence) 30%, or no data in a specific year. Source: Behavioral Risk Factor Surveillance System, CDC.
Prevalence of Obesity Based on Self-Reported Weight and Height Among Non-Hispanic Black Adults, by State and Territory, BRFSS, 2021 2023 Summary No state or territory had a prevalence of obesity less than 25%. 5 states had a prevalence of obesity between 25% and <30%. 5 states had a prevalence of obesity between 30% and <35%. 13 states, Virgin Islands, and the District of Columbia had a prevalence of obesity between 35% and <40%. 12 states had a prevalence of obesity between 40% and <45%. 10 states had a prevalence of obesity between 45% and <50%. Montana had a prevalence of obesity 50% or greater.
Prevalence of Obesity Based on Self-Reported Weight and Height Among Hispanic Adults, by State and Territory, BRFSS, 2021 2023 *Sample size <50, the relative standard error (dividing the standard error by the prevalence) 30%, or no data in a specific year.
Prevalence of Obesity Based on Self-Reported Weight and Height Among Hispanic Adults, by State and Territory, BRFSS, 2021 2023 State Alabama Alaska Arizona Arkansas California Colorado Connecticut Delaware District of Columbia Florida Georgia Guam Hawaii Idaho Illinois Indiana Iowa Kansas Kentucky Louisiana Maine Maryland Massachusetts Michigan Minnesota Mississippi Missouri Prevalence 36.1 34.6 38.1 35.6 35.9 30.9 36.0 34.0 28.3 Insufficient data* 33.5 30.8 32.1 36.2 41.3 40.5 37.5 39.0 Insufficient data* 36.8 34.8 35.7 35.3 39.3 33.9 41.2 37.7 95% Confidence Interval (28.8, 44.1) (29.7, 39.9) (36.2, 40.0) (30.4, 41.2) (34.5, 37.4) (29.2, 32.6) (33.6, 38.6) (29.5, 38.7) (23.6, 33.4) Insufficient data* (30.0, 37.3) (22.9, 40.0) (29.1, 35.3) (33.2, 39.4) (37.9, 44.8) (37.4, 43.7) (34.5, 40.5) (36.2, 42.0) Insufficient data* (31.3, 42.7) (28.6, 41.6) (33.3, 38.1) (32.8, 37.9) (34.9, 43.9) (31.2, 36.7) (32.0, 51.0) (32.8, 42.9) State Montana Nebraska Nevada New Hampshire New Jersey New Mexico New York North Carolina North Dakota Ohio Oklahoma Oregon Pennsylvania Puerto Rico Rhode Island South Carolina South Dakota Tennessee Texas Utah Vermont Virgin Islands Virginia Washington West Virginia Wisconsin Wyoming Prevalence 38.5 37.1 35.5 40.4 33.6 37.9 33.0 33.7 33.8 36.4 42.4 38.6 Insufficient data* 35.4 34.9 32.7 37.0 36.8 39.2 36.2 32.9 37.8 32.1 37.6 37.1 35.6 40.7 95% Confidence Interval (32.9, 44.3) (34.6, 39.7) (32.0, 39.1) (33.5, 47.6) (31.6, 35.6) (35.9, 40.0) (31.6, 34.5) (30.2, 37.3) (27.8, 40.4) (32.2, 40.8) (38.9, 45.9) (35.6, 41.8) Insufficient data* (34.2, 36.5) (32.0, 37.9) (28.7, 36.9) (28.6, 46.4) (31.3, 42.8) (37.4, 41.1) (34.1, 38.4) (26.5, 40.0) (29.5, 46.9) (28.8, 35.6) (35.8, 39.5) (28.5, 46.5) (31.7, 39.8) (36.0, 45.7) *Sample size <50, the relative standard error (dividing the standard error by the prevalence) 30%, or no data in a specific year. Source: Behavioral Risk Factor Surveillance System, CDC.
Prevalence of Obesity Based on Self-Reported Weight and Height Among Hispanic Adults, by State and Territory, BRFSS, 2021 2023 Summary No state or territory had a prevalence of obesity less than 25%. The District of Columbia had a prevalence of obesity between 25% and <30%. 15 states and Guam had a prevalence of obesity between 30% and <35%. 26 states, Puerto Rico, and Virgin Islands had a prevalence of obesity between 35% and <40%. 6 states had a prevalence of obesity between 40% and <45%. No state or territory had a prevalence of obesity 45% or greater.
Prevalence of Obesity Based on Self-Reported Weight and Height Among Non-Hispanic Asian Adults, by State and Territory, BRFSS, 2021 2023 *Sample size <50, the relative standard error (dividing the standard error by the prevalence) 30%, or no data in a specific year.
Prevalence of Obesity Based on Self-Reported Weight and Height Among Non-Hispanic Asian Adults, by State and Territory, BRFSS, 2021 2023 State Montana Nebraska Nevada New Hampshire New Jersey New Mexico New York North Carolina North Dakota Ohio Oklahoma Oregon Pennsylvania Puerto Rico Rhode Island South Carolina South Dakota Tennessee Texas Utah Vermont Virgin Islands Virginia Washington West Virginia Wisconsin Wyoming Prevalence Insufficient data* 15.3 20.8 9.4 13.3 15.5 14.1 11.4 23.0 13.7 13.4 13.4 Insufficient data* Insufficient data* 14.0 12.2 Insufficient data* Insufficient data* 13.0 10.6 11.0 Insufficient data* 13.2 11.7 Insufficient data* 15.9 Insufficient data* 95% Confidence Interval Insufficient data* (10.5, 21.8) (14.3, 29.1) (6.0, 14.4) (11.1, 16.0) (8.6, 26.3) (12.2, 16.2) (7.6, 16.8) (15.1, 33.4) (10.1, 18.4) (8.2, 21.0) (9.9, 17.9) Insufficient data* Insufficient data* (9.8, 19.7) (7.1, 20.1) Insufficient data* Insufficient data* (9.6, 17.4) (7.6, 14.7) (6.1, 19.0) Insufficient data* (10.1, 17.0) (10.3, 13.3) Insufficient data* (10.7, 23.0) Insufficient data* State Alabama Alaska Arizona Arkansas California Colorado Connecticut Delaware District of Columbia Florida Georgia Guam Hawaii Idaho Illinois Indiana Iowa Kansas Kentucky Louisiana Maine Maryland Massachusetts Michigan Minnesota Mississippi Missouri Prevalence Insufficient data* 23.9 13.1 15.2 11.6 11.6 13.3 15.6 11.5 Insufficient data* 16.0 17.5 17.8 Insufficient data* 10.0 10.3 13.0 12.1 Insufficient data* 17.3 Insufficient data* 14.3 11.2 10.2 19.7 Insufficient data* 11.6 95% Confidence Interval Insufficient data* (18.3, 30.5) (9.8, 17.4) (8.6, 25.4) (9.9, 13.6) (8.5, 15.6) (10.0, 17.4) (10.1, 23.3) (7.5, 17.1) Insufficient data* (11.4, 22.0) (14.3, 21.2) (16.5, 19.2) Insufficient data* (7.3, 13.6) (6.7, 15.3) (8.8, 18.7) (9.0, 16.2) Insufficient data* (11.3, 25.5) Insufficient data* (11.8, 17.1) (8.8, 14.2) (7.4, 13.7) (17.0, 22.8) Insufficient data* (7.5, 17.5) *Sample size <50, the relative standard error (dividing the standard error by the prevalence) 30%, or no data in a specific year. Source: Behavioral Risk Factor Surveillance System, CDC.
Prevalence of Obesity Based on Self-Reported Weight and Height Among Non-Hispanic Asian Adults, by State and Territory, BRFSS, 2021 2023 Summary 35 states, the District of Columbia, and Guam had a prevalence of obesity less than 20%. 3 states (Alaska, Nevada, and North Dakota) had a prevalence of obesity between 20% and <25%. No state had a prevalence of obesity 25% or greater
Prevalence of Obesity Based on Self-Reported Weight and Height Among Non-Hispanic American Indian or Alaska Native Adults, by State and Territory, BRFSS, 2021 2023 *Sample size <50, the relative standard error (dividing the standard error by the prevalence) 30%, or no data in a specific year.
Prevalence of Obesity Based on Self-Reported Weight and Height Among Non-Hispanic American Indian or Alaska Native Adults, by State and Territory, BRFSS, 2021 2023 State Alabama Alaska Arizona Arkansas California Colorado Connecticut Delaware District of Columbia Florida Georgia Guam Hawaii Idaho Illinois Indiana Iowa Kansas Kentucky Louisiana Maine Maryland Massachusetts Michigan Minnesota Mississippi Missouri Prevalence 43.1 37.3 48.1 35.4 36.2 33.6 29.1 34.4 Insufficient data* Insufficient data* 23.4 Insufficient data* Insufficient data* 44.5 32.4 34.7 48.1 45.6 Insufficient data* 38.3 41.2 31.9 31.0 31.9 42.1 30.9 32.7 95% Confidence Interval (31.1, 56.0) (34.1, 40.7) (43.9, 52.2) (27.5, 44.3) (27.7, 45.7) (26.4, 41.7) (18.6, 42.4) (20.9, 51.0) Insufficient data* Insufficient data* (14.7, 35.1) Insufficient data* Insufficient data* (35.6, 53.9) (20.0, 47.7) (26.4, 44.0) (37.2, 59.2) (39.0, 52.3) Insufficient data* (29.6, 47.9) (33.6, 49.3) (23.7, 41.4) (20.4, 44.1) (23.0, 42.2) (35.9, 48.6) (18.0, 47.6) (24.3, 42.4) State Montana Nebraska Nevada New Hampshire New Jersey New Mexico New York North Carolina North Dakota Ohio Oklahoma Oregon Pennsylvania Puerto Rico Rhode Island South Carolina South Dakota Tennessee Texas Utah Vermont Virgin Islands Virginia Washington West Virginia Wisconsin Wyoming Prevalence 39.0 40.4 37.5 33.1 Insufficient data* 42.3 34.2 37.5 47.1 35.9 45.2 43.3 Insufficient data* Insufficient data* 42.4 42.3 46.1 33.2 39.6 43.2 33.7 Insufficient data* 35.3 43.2 48.9 48.5 39.5 95% Confidence Interval (35.3, 42.9) (32.9, 48.4) (26.3, 50.2) (20.6, 48.5) Insufficient data* (37.7, 47.1) (24.9, 44.8) (30.3, 45.4) (41.6, 52.7) (26.5, 46.4) (41.9, 48.6) (34.1, 52.9) Insufficient data* Insufficient data* (30.0, 55.8) (33.5, 51.6) (38.8, 53.7) (23.7, 44.4) (26.4, 54.5) (35.2, 51.5) (24.2, 44.7) Insufficient data* (24.9, 47.3) (37.8, 48.8) (36.5, 61.5) (40.3, 56.9) (30.4, 49.5) *Sample size <50, the relative standard error (dividing the standard error by the prevalence) 30%, or no data in a specific year. Source: Behavioral Risk Factor Surveillance System, CDC.
Prevalence of Obesity Based on Self-Reported Weight and Height Among Non-Hispanic American Indian or Alaska Native Adults, by State and Territory, BRFSS, 2021 2023 Summary No state or territory had a prevalence of obesity less than 20%. Georgia had a prevalence of obesity between 20% and <25%. Connecticut had a prevalence of obesity between 25% and <30%. 13 states had a prevalence of obesity between 30% and <35%. 11 states had a prevalence of obesity between 35% and <40%. 11 states had a prevalence of obesity between 40% and <45%. 8 states had a prevalence of obesity between 45% and <50%. No state or territory had a prevalence of obesity 50% or greater.
