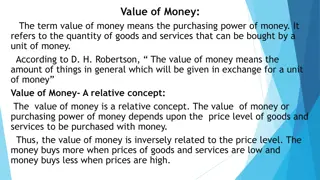
Price-Perceived Value Analysis
Explore the interplay between perceived value and pricing strategies in competitive markets. Learn how businesses can enhance perceived value, determine price ranges, and optimize profits. Discover insights on market-based pricing, cost considerations, and customer value perception.

Download Presentation

Please find below an Image/Link to download the presentation.
The content on the website is provided AS IS for your information and personal use only. It may not be sold, licensed, or shared on other websites without obtaining consent from the author.If you encounter any issues during the download, it is possible that the publisher has removed the file from their server.
You are allowed to download the files provided on this website for personal or commercial use, subject to the condition that they are used lawfully. All files are the property of their respective owners.
The content on the website is provided AS IS for your information and personal use only. It may not be sold, licensed, or shared on other websites without obtaining consent from the author.
E N D
Presentation Transcript
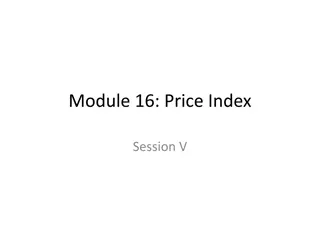
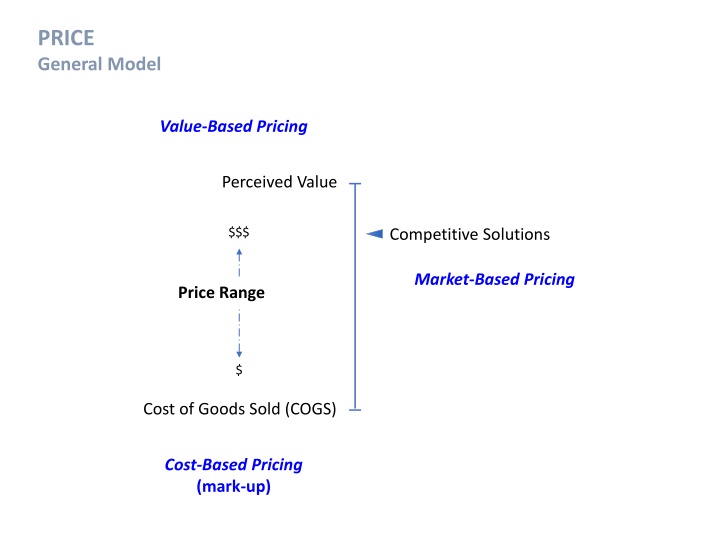
PRICE General Model Value-Based Pricing Perceived Value $$$ Competitive Solutions Market-Based Pricing Price Range $ Cost of Goods Sold (COGS) Cost-Based Pricing (mark-up)
PRICE Price/Product Relationship Price Product Perceived Value Augmented Product (market offering) brand selection guidance fitting alterations financing terms insurance** timing environment* newness novelty scarcity $$$ supply & demand Price Range Functional Value Core Product core features incremental features $ Cost of Goods Sold (COGS) Raw Materials *took took story and weather in Bangkok, popsicle in summer vs. popsicle in winter ** auto dealership business model (scarcity) ride during rush-hour (Uber) Craig s List vs. used car lot vs. car dealership
PRICE maximize the amount of perceived value captured perceived value vs. functional value Perceived Value $$$ Competitive Solutions brand can increase perceived value beyond functional value of competing solutions but doesn t always Price Range (e.g., Apple vs. Southwest Airlines) $ Cost of Goods Sold (COGS) pricing floor unless we are buying business, making up for an error, or betting on lifetime customer value (LCV) (e.g., HP printers)
PRICE Perceived Value Augmented Product (market offering) brand selection guidance fitting alterations financing terms insurance** timing environment* newness novelty scarcity $$$ supply & demand Price Range Functional Value Core Product core features incremental features $ Cost of Goods Sold (COGS) *took took story and weather in Bangkok, popsicle in summer vs. popsicle in winter ** auto dealership business model (scarcity) ride during rush-hour (Uber) Craig s List vs. used car lot vs. car dealership
PRICE Value-Based Pricing Market-Based Pricing Perceived Value $$$ Competitive Solutions Price Range $ Cost of Goods Sold (COGS) Cost-Based Pricing
PRICE Perceived Value $$$ Competitive Solutions Price Range $ Cost of Goods Sold (COGS) Retail Keystone: 2x Cost used when we need to assure costs are covered, but we are unsure of perceived value. The perceived value will be slightly different for different customers. depends on magnitude of price, turn-over frequency, and business model Onaverage, barely 5 per cent of a dealer's profit comes from new car sales. The majority (about 50 per cent) comes from parts and service, while the remainder comes from finance and insurance (30 per cent) and the balance is from used cars (15 per cent).
PRICE Inventory Turnover Gas Station Jewelry Store Industry ratios (benchmarking): Inventory turnover (days) (readyratios.com) How Do Retailers Sell Things for So Cheap? (azcentral.com)
PRICE Perceived Value $$$ Competitive Solutions Price Range Ca differential cost basis $ Cb increase margins or undercut competitors Cost of Goods Sold (COGS) Cc some require higher operating margins to cover operating costs (e.g., Walmart ) price -> volume -> cost
Intel Example Forward Pricing $ $ $ $ $ $ $ $ $ $ $ $ market requirement $ $ unit cost $ 0 v Hillsboro, OR (2019) . . . . . . . . . . . $5.0 billion Leixlip, Ireland (2019) . . . . . . . . . . $8.0 billion Qiryat Gat, Israel (2019) . . . . . . . . $11.0 billion
PRICE Perceived Value $$$ Competitive Solutions Price Range Nash Equilibrium reduce price to point sales margin equals operating cost + required profit $ Cost of Goods Sold (COGS) operate in a competitive range and preserve margin for all players (e.g., gas station) tacit collusion
PRICE short-term vs. long-term price equilibrium Perceived Value Competitive Solutions (Cb, Cc, Cn) $$$ Ca Price Price Range pushing price below value creates purchase pressure especially if time-limited $ Cost of Goods Sold (COGS) differential cost basis allows pushing price below competitors sales promotions If not time-limited then it becomes the perceived value over time premiums coupons (e.g., $5 foot-long ) (e.g., $5 Friday )
promotions/specials private labels maximize cart value cost-based pricing price volume cost
Pricing Strategy Market Penetration Skimming the Cream COGS, perceived value, competition Price elasticity forward pricing variable cost-based pricing
PRICE Other Models Value-Based Market-Based -> status quo, dynamic pricing Cost-Based -> Keystone, target margin Costco Amazon Prime OPEC Uber surge pricing (equilibrium) eBay (supply vs. demand), Get a Trailer Acquisition Cost -> Margin -> LCV Promotions, premiums, coupons BOGO (price -> volume -> cost or lost leader) Maximize margin of the cart relationship between pricing model and business model
Business Strategy Business Model Resource Model Operating Model Marketing Model supply chain Output - products - services people Process - capabilities - core competencies product source(s) promotion brand composition Input - tangible (land, labor, capital) - intangible strategy place integration price velocity/volume (v2) own, insource, outsource, offshore