Prioritizing CA Project Indicators for StreamNet Partners
Explore the process of identifying and prioritizing indicators for the CA project, involving the Executive Committee and stakeholders. The roadmap involves determining data needs, prioritizing orders, and involving relevant stakeholders. Proposed bins of indicators, evaluating potential indicators, and engaging key documents and players are vital steps in the process.

Download Presentation

Please find below an Image/Link to download the presentation.
The content on the website is provided AS IS for your information and personal use only. It may not be sold, licensed, or shared on other websites without obtaining consent from the author. If you encounter any issues during the download, it is possible that the publisher has removed the file from their server.
You are allowed to download the files provided on this website for personal or commercial use, subject to the condition that they are used lawfully. All files are the property of their respective owners.
The content on the website is provided AS IS for your information and personal use only. It may not be sold, licensed, or shared on other websites without obtaining consent from the author.
E N D
Presentation Transcript
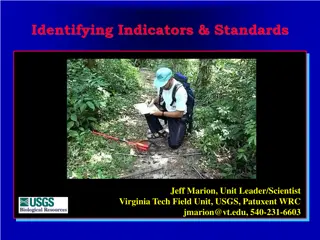
IDENTIFYING AND PRIORITIZING INDICATORS FOR THE CA PROJECT FOR STREAMNET PARTNERS, USING THE EXECUTIVE COMMITTEE TO PRIORITIZE, BASED ON YOUR INPUT FOR NON-STREAMNET PARTNERS, HOPE TO GET YOUR PARTICIPATION AND ACCEPTANCE OF PRIORITIES THROUGH THIS DISCUSSION AND PROCESS
ROAD MAP FOR THE CA PROJECT 1. WHO NEEDS THE DATA? 2. WHAT DATA DO THEY NEED? 3. REGIONALLY SIGNIFICANT? IN NEED OF STANDARDIZATION? 4. WHAT IS THE PRIORITY ORDER, WHAT IS NEEDED FIRST? 5. ARE THE RIGHT PEOPLE INVOLVED IN THE PROCESS?
HIGH LEVEL INDICATORS INDICATOR. N. A NUMERIC OR DESCRIPTIVE PARAMETER, THE VALUE OF WHICH SUMMARIZES IMPORTANT INFORMATION REGARDING THE STATUS OF PARTICULAR CONDITIONS RELATIVE TO A HIGH-LEVEL GOAL, OBJECTIVE, OR DESIRED STATE. VALUE RESULTING FROM THE DATA REDUCTION OF METRICS ACROSS SITES AND TEMPORAL PERIODS BASED ON APPLYING THE PROCEDURES IN THE INFERENCE DESIGN. A REPORTED VALUE USED TO INDICATE THE STATUS, CONDITION, OR TREND OF A RESOURCE OR ECOLOGICAL PROCESS; INTENDED TO ANSWER QUESTIONS POSED BY THE OBJECTIVES OF THE PROTOCOL. CONTRAST WITH METRIC. METRIC J + METRIC K = INDICATOR X PER THE INFERENCE DESIGN, METRICS ARE COMBINED OR REDUCED TO PRODUCE INDICATORS.
PROCESS FOR IDENTIFYING & PRIORITIZING INDICATORS IDENTIFY INDICATORS BY BINS PRIORITIZE INDICATORS WITHIN BINS LOCATE KEY DOCUMENTS SET UP SURVEY MONKEY REVIEW GENERALLY HERE TODAY; THEN NEED TO ADD PRECISE DEFINITIONS ASK AGENCIES AND TRIBES FOR IDEAS AND FOR INPUT ON PRIORITIES ASK REGIONAL F&W MANAGERS TO REVIEW OUR LIST (COUNCIL 2012 ?) COLLECT INPUT & PRIORITIZATION IDEAS USING THE SURVEY AND MAKE A PRELIMINARY RECOMMENDATION FINALIZE LIST Report Results to the StreamNet Executive Committee
PROPOSED BINS OF INDICATORS NATURAL ORIGIN SALMON & STEELHEAD HATCHERY FISH/HATCHERY PROGRAMS HATCHERY FISH IMPACTS TO NATURAL ORIGIN FISH RESIDENT (AND OTHER ANADROMOUS) FISH ARE THERE OTHER BINS WE VE MISSED?
EVALUATING POTENTIAL BINS AND INDICATORS SOURCE DOCUMENTS: NOAA VSP; COUNCIL; BIOP (AMIP); HSRG; LOWER SNAKE COMP; USFWS; ODFW; MFWP; IDFG DID WE MISS KEY DOCUMENTS OR DATA TARGETS? ARE THERE OTHER PLAYERS WE NEED TO CONTACT? OTHER IDEAS OR SUGGESTIONS?
OTHER HIGH LEVEL INDICATORS FOR NATURAL ORIGIN SALMON & STEELHEAD EXISTING POSSIBLE NEW? NOSA SPATIAL STRUCTURE SAR STAGE-SPECIFIC JUVENILE SURVIVAL RPERS POPULATION DIVERSITY JUVENILE ABUNDANCE OTHER?
OTHER HATCHERY INDICATORS EXISTING POSSIBLE NEW? NUMBER SPAWNED TOTAL RETURN (INCLUDING FISHERIES CONTRIBUTION) PNOB STRAY RATE EGGS TAKEN OTHER? PNI EGG TO RELEASE SURVIVAL SAR RPERS
HATCHERY FISH IMPACTS TO NATURAL ORIGIN FISH ? HATCHERY PROGRAM/IMPACTED NATURAL ORIGIN POPULATION PHOS PNI PNOB Others?
RESIDENT (AND OTHER ANADROMOUS) FISH INDICATORS ? ABUNDANCE DIVERSITY PRODUCTIVITY ARTIFICIAL PRODUCTION (MITIGATION MEASURE) SPATIAL DISTRIBUTION: ANNUAL RELEASES OF HATCHERY-REARED RESIDENT FISH RELEASED FROM PROGRAM- FUNDED HATCHERIES: NPCC HLI (2012)
What scale for resident indicators? bull trout bull trout bull trout bull trout bull trout bull trout Population Population Population Population Recovery Unit Recovery Unit Abundance Distribution Abundance trend - qualitative Life history status - qualitative Abundance Abundance trend - qualitative Abundance by population Geographic distribution of populations Increasing, stable, decreasing viable/not viable? Abundance by recovery unit Increasing, stable, decreasing lamprey lamprey lamprey Region and Sub-region Region and Sub-region Region and Sub-region Abundance Abundance trend - qualitative Distribution Counts at various dams/subbasins Increasing, stable, decreasing current/historic distribution sturgeon sturgeon sturgeon sturgeon sturgeon sturgeon Age class Sub-population Sub-population Sub-population Sub-population Sub-population Productivity Abundance Distribution Diversity Productivity Productivity population size structure Number in certain size range Distribution within available habitats (sub-regions)' Genetic Diversity Annual Age-1 recruitment Population size structure
What scale for the indicators? cutthroat cutthroat cutthroat cutthroat cutthroat cutthroat cutthroat redband redband redband redband redband redband Geographic management area Population Population Population Population Population sub-population population population population population population population Abundance Abundance Distribution Diversity Distribution Distribution Abundance productivity reproductive independence distribution distribution Density Hybridization Genetic diversity miles of habitat occupied Number of miles of conservation populations total stream distance occupied percent of basin occupied degree to which it is isolated from other populations WSC trout WSC trout WSC trout WSC trout population population population population Diversity abundance abundance connectivity Genetic diversity number of spawners reproductive rate
NEXT STEPS ARE THERE ANY OTHER BINS THAT WE MISSED? PRIORITIZE INDICATORS WITHIN BINS SET UP SURVEY MONKEY AND COLLECT INPUT USING THE SURVEY REPORT RESULTS TO STREAMNET EXECUTIVE COMMITTEE, ASK FOR THEIR DETERMINATION REPORT PRIORITIZED LIST OF INDICATORS TO THE LARGER CA GROUP DISCUSS IMPLEMENTATION OF NEXT INDICATORS IN PRIORITY ORDER. THEN; IDENTIFY FULL LIST OF INTERESTED PARTIES FOR EACH NEW INDICATOR DES DEVELOPMENT DATA FLOW DISCUSSIONS
First Name Russell John Bryan Henry Gene Brad Brandon Shockley Evan Affiliation Last Name Email BPA CCT CTGR CRITFC CTUIR CTWSRO FPC IDFG Kalispel Tribes Joe MFWP NOAA NPCC NPT ODFW SBT UCUT USFWS USRT WA GSRO WDFW YN Scranton Arterburn Fendall Franzoni Shippentower GeneShippentower@ctuir.org Houslet brad.houslet@ctwsbnr.org bchockley@fpc.org Brown Evan.brown@idfg.idaho.gov Maroney jmaroney@kalispeltribe.com Anderson dawanderson@mt.gov Cooney tom.cooney@noaa.gov Leonard nleonard@nwcouncil.org Hesse jayh@nezperce.org Carmichael richard.w.carmichael@state.or.us Denny ldenny@sbtribes.com Kutchins keith@ucut-nsn.org Connoly sean_connolly@fws.gov Austin bob@usrtf.org Dublanica keith.dublanica@rco.wa.gov Rawding rawdidr@dfw.wa.gov Bosch bbosch@yakama.com rwscranton@bpa.gov john.arterburn@colvilletribes.com Bryan.Fendall@grandronde.org frah@critfc.org Dawn Tom Nancy Jay Rich Lytle Keith Sean Robert Keith Dan Bill
OTHER HATCHERY FISH/HATCHERY PROGRAM INDICATORS? SOURCE DOCUMENTS: HSRG; COUNCIL; LOWER SNAKE COMP DID WE MISS KEY DOCUMENTS OR DATA TARGETS? ARE THERE OTHER PLAYERS WE NEED TO CONTACT? OTHER IDEAS OR SUGGESTIONS?
OTHER INDICATORS FOR HATCHERY FISH IMPACTS TO NATURAL ORIGIN FISH ? SOURCE DOCUMENTS: HSRG; COUNCIL; LOWER SNAKE COMP DID WE MISS KEY DOCUMENTS OR DATA TARGETS? ARE THERE OTHER PLAYERS WE NEED TO CONTACT? OTHER IDEAS OR SUGGESTIONS?
RESIDENT (AND OTHER ANADROMOUS) FISH INDICATORS? SOURCE DOCUMENTS: USFWS; COUNCIL; ODFW; MFWP; IDFG DID WE MISS KEY DOCUMENTS OR DATA TARGETS? ARE THERE OTHER PLAYERS WE NEED TO CONTACT? OTHER IDEAS OR SUGGESTIONS?
Additional NOS Indicators for Salmon & Steelhead? NO salmon & steelhead Natural spawning population Spatial structure NO salmon & steelhead Natural spawning population "Freshwater production" (Measured how?) NO salmon & steelhead Natural spawning population Stage-specific juvenile survival. NO salmon & steelhead Natural spawning population Dam passage survival rate. (Adult, juv, or both? By population/ESU/etc. ?) NO salmon & steelhead Natural spawning population Adult status and trends, by population. With known statistical certainty and power. NO salmon & steelhead Natural spawning population Productivity (full life cycle), by population. With known statistical certainty and power. NO salmon & steelhead Species Running 4-year mean of adult abundance falls below 20% likelihood. NO salmon & steelhead Species Running 4-year mean of adult abundance falls below 10% likelihood. NO salmon & steelhead Natural spawning population Changes (trends) in size of spawners, age of spawners, fecundity. NO salmon & steelhead Natural spawning population Diversity: human factors should not change variation in run timing, age structure, size, fecundity, morphology, behavior, genetics, etc. NO salmon & steelhead Natural spawning population Barriers NO salmon & steelhead Natural spawning population 4-year running sums of number of spawners in a population
Hatchery Indicators Hatchery salmon Hatchery salmon Hatchery salmon Hatchery salmon Hatchery salmon Hatchery salmon Hatchery salmon Hatchery salmon Hatchery salmon Hatchery salmon Hatchery salmon Hatchery salmon Hatchery salmon Hatchery salmon Hatchery population Hatchery population Hatchery population Hatchery population Hatchery population Hatchery population Hatchery population Hatchery population Hatchery population Hatchery population Hatchery population Hatchery population Hatchery population Hatchery population Fisheries contribution Green egg to smolt survival In-hatchery survivals (multiple?) Number marked (type of mark) pre-spawning survival (generally reported as pre-spawning mortality) RperS SAR Smolt size at release Smolts released Total return (survival including fisheries contribution) Also suggested by DDT members: Stray rate Also suggested by DDT members: Catch/escapement profile. Also suggested by DDT members: Total number & origin collected for broodstock. Also suggested by DDT members: Fedundity and lengths.


 FISH")


 FISH")