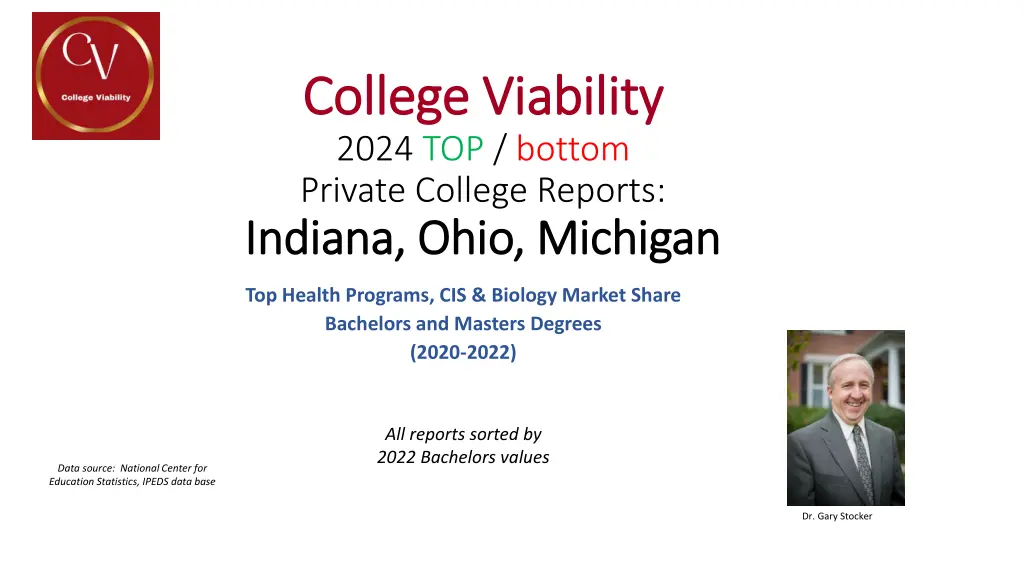
Private College Reports 2024 - Top Programs in Indiana, Ohio, Michigan
Explore the top health programs, CIS, and biology market share for bachelor's and master's degrees from 2020-2022 in private colleges across Indiana, Ohio, and Michigan. Data sourced from the National Center for Education Statistics and IPEDS database.

Uploaded on | 1 Views
Download Presentation

Please find below an Image/Link to download the presentation.
The content on the website is provided AS IS for your information and personal use only. It may not be sold, licensed, or shared on other websites without obtaining consent from the author. If you encounter any issues during the download, it is possible that the publisher has removed the file from their server.
You are allowed to download the files provided on this website for personal or commercial use, subject to the condition that they are used lawfully. All files are the property of their respective owners.
The content on the website is provided AS IS for your information and personal use only. It may not be sold, licensed, or shared on other websites without obtaining consent from the author.
E N D
Presentation Transcript
College Viability College Viability 2024 TOP / bottom Private College Reports: Indiana, Ohio, Michigan Indiana, Ohio, Michigan Top Health Programs, CIS & Biology Market Share Bachelors and Masters Degrees (2020-2022) All reports sorted by 2022 Bachelors values Data source: National Center for Education Statistics, IPEDS data base Dr. Gary Stocker
IN, OH, MI, Private College Program Completion Top / bottom Reports Top Program Completion Counts 2020-2022 IN Purdue University Global Indiana University-Purdue University-Indianapolis Purdue University Northwest Indiana Wesleyan University- National & Global Purdue University-Main Campus University of Southern Indiana Marian University Indiana State University 1651 1949 1706 55 969 1064 1043 74 Health Prof. Public, 4-year IN IN 896 693 975 600 1053 633 157 -60 354 38 387 59 352 118 -2 80 Health Prof. Public, 4-year Health Prof. Public, 4-year IN IN IN IN IN 480 501 394 360 311 540 479 429 364 306 471 462 380 351 302 -9 -39 -14 -9 -9 542 93 211 7 203 482 99 200 4 204 416 122 222 4 165 -126 29 11 -3 -38 Health Prof. Private Health Prof. Public, 4-year Health Prof. Public, 4-year Health Prof. Private Health Prof. Public, 4-year IN IN IN Ball State University Indiana University-Bloomington Indiana University-South Bend 280 300 192 263 252 166 271 225 210 -9 -75 18 169 120 24 122 109 16 115 138 12 -54 18 -12 Health Prof. Public, 4-year Health Prof. Public, 4-year Health Prof. Public, 4-year IN IN IN Valparaiso University Indiana University-Kokomo University of Indianapolis Indiana Wesleyan University- Marion University of Saint Francis-Fort Wayne Indiana University-Northwest 196 220 187 195 179 192 196 182 163 0 27 23 112 47 41 158 44 19 116 17 -4 4 Health Prof. Private Health Prof. Public, 4-year Health Prof. Private -38 -24 IN 159 178 154 -5 39 48 61 22 Health Prof. Private IN IN 164 159 133 167 152 140 -12 -19 87 14 104 14 83 10 -4 -4 Health Prof. Private Health Prof. Public, 4-year
IN, OH, MI, Private College Program Completion Top / bottom Reports Top Program Completion Market Share Percentages 2020-2022 Indiana Health Professions Indiana Health Professions Market Share Market Share 3-Year Bachelors Change 1.3% 2020 Masters 29.2% 2021 Masters 30.2% 2022 Masters 30.7% 3-Year Masters Change 1.5% State College 2020 Bachelors 2021 Bachelors 2022 Bachelors 20.3% 23.8% Program Health Prof. Type IN Purdue University Global 21.6% Public, 4-year Indiana University-Purdue University- Indianapolis Purdue University Northwest IN IN 11.0% 8.5% 11.9% 7.3% 13.4% 8.0% 2.3% -0.5% 10.7% 1.1% 11.0% 1.7% 10.4% 3.5% -0.3% 2.3% Health Prof. Health Prof. Public, 4-year Public, 4-year Indiana Wesleyan University-National & Global Purdue University-Main Campus University of Southern Indiana Marian University Indiana State University Ball State University Indiana University-Bloomington Indiana University-South Bend Valparaiso University Indiana University-Kokomo University of Indianapolis IN IN IN IN IN IN IN IN IN IN IN 5.9% 6.2% 4.8% 4.4% 3.8% 3.4% 3.7% 2.4% 2.4% 2.7% 2.3% 6.6% 5.8% 5.2% 4.4% 3.7% 3.2% 3.1% 2.0% 2.4% 2.2% 2.3% 6.0% 5.9% 4.8% 4.5% 3.8% 3.4% 2.9% 2.7% 2.5% 2.3% 2.1% 0.1% -0.3% 0.0% 0.0% 0.0% 0.0% -0.8% 0.3% 0.1% -0.4% -0.2% 16.4% 2.8% 6.4% 0.2% 6.1% 5.1% 3.6% 0.7% 0.8% 0.7% 3.4% 13.7% 2.8% 5.7% 0.1% 5.8% 3.5% 3.1% 0.5% 1.3% 1.2% 4.5% 12.2% 3.6% 6.5% 0.1% 4.9% 3.4% 4.1% 0.4% 1.3% 0.6% 3.4% -4.1% 0.8% 0.2% -0.1% -1.3% -1.7% 0.4% -0.4% 0.5% -0.1% 0.0% Health Prof. Health Prof. Health Prof. Health Prof. Health Prof. Health Prof. Health Prof. Health Prof. Health Prof. Health Prof. Health Prof. Private Public, 4-year Public, 4-year Private Public, 4-year Public, 4-year Public, 4-year Public, 4-year Private Public, 4-year Private IN Indiana Wesleyan University-Marion 2.0% 2.2% 2.0% 0.0% 1.2% 1.4% 1.8% 0.6% Health Prof. Private IN IN IN IN University of Saint Francis-Fort Wayne Indiana University-Northwest Butler University Indiana University-East 2.0% 2.0% 1.3% 0.9% 1.6% 2.0% 1.1% 0.9% 1.9% 1.8% 1.4% 1.0% -0.1% -0.2% 0.2% 0.1% 2.6% 0.4% 2.4% 0.5% 2.9% 0.4% 2.1% 0.5% 2.4% 0.3% 2.1% 0.3% -0.2% -0.1% -0.3% -0.2% Health Prof. Health Prof. Health Prof. Health Prof. Private Public, 4-year Private Public, 4-year
IN, OH, MI, Private College Program Completion Top / bottom Reports Top Program Completion Counts 2020-2022 Ohio Health Professions Raw Data/numbers Ohio Health Professions Raw Data/numbers 3-Year Bachelors Change -69 68 3 -49 88 -17 63 -9 2 21 -13 -5 -6 -20 3 1 15 10 -20 3-Year Masters Change 5 8 -63 5 36 3 41 2 0 1 -3 4 2020 Bachelors 1042 382 268 288 124 223 127 138 110 86 106 97 91 102 73 67 49 50 74 2021 Bachelors 959 396 278 310 125 224 160 131 102 95 121 103 75 122 70 74 49 44 60 2022 Bachelors 973 450 271 239 212 206 190 129 112 107 93 92 85 82 76 68 64 60 54 2020 Masters 146 93 213 9 58 21 209 19 11 3 4 5 2021 Masters 133 82 157 17 79 25 232 20 20 7 3 11 2022 Masters 151 101 150 14 94 24 250 21 11 4 1 9 State College Program Type Biology Biology Biology Biology Biology Biology Biology Biology Biology Biology Biology Biology Biology Biology Biology Biology Biology Biology Biology OH OH OH OH OH OH OH OH OH OH OH OH OH OH OH OH OH OH OH Ohio State University-Main Campus University of Cincinnati-Main Campus Miami University-Oxford Ohio University-Main Campus University of Toledo Kent State University at Kent Case Western Reserve University Bowling Green State University-Main Campus University of Akron Main Campus Cleveland State University University of Dayton Youngstown State University The College of Wooster Wright State University-Main Campus John Carroll University Oberlin College Ashland University Ohio Wesleyan University Denison University Public, 4-year Public, 4-year Public, 4-year Public, 4-year Public, 4-year Public, 4-year Private Public, 4-year Public, 4-year Public, 4-year Private Public, 4-year Private Public, 4-year Private Private Private Private Private 78 6 71 4 59 9 -19 3 6 0 13 7
IN, OH, MI, Private College Program Completion Top / bottom Reports Top Program Completion Market Share Percentages 2020-2022 Ohio Health Professions Market Share Ohio Health Professions Market Share 3-Year Bachelors Change -2.1% 1.4% 0.0% -1.3% 2.0% -0.5% 1.4% -0.3% 0.0% 0.5% -0.3% -0.2% -0.2% -0.5% 0.0% 0.0% 0.3% 3-Year Masters Change -0.3% 0.4% -8.0% 0.5% 3.6% 0.2% 3.3% 0.1% -0.1% 0.1% -0.3% 0.4% 0.0% -2.5% 0.3% 0.0% 0.7% 2020 Bachelors 24.7% 9.1% 6.4% 6.8% 2.9% 5.3% 3.0% 3.3% 2.6% 2.0% 2.5% 2.3% 2.2% 2.4% 1.7% 1.6% 1.2% 2021 Bachelors 22.4% 9.3% 6.5% 7.3% 2.9% 5.2% 3.7% 3.1% 2.4% 2.2% 2.8% 2.4% 1.8% 2.9% 1.6% 1.7% 1.1% 2022 Bachelors 22.7% 10.5% 6.3% 5.6% 4.9% 4.8% 4.4% 3.0% 2.6% 2.5% 2.2% 2.1% 2.0% 1.9% 1.8% 1.6% 1.5% 2020 Masters 16.6% 10.5% 24.1% 1.0% 6.6% 2.4% 23.7% 2.2% 1.2% 0.3% 0.5% 0.6% 0.0% 8.8% 0.7% 0.0% 0.7% 2021 Masters 15.1% 9.3% 17.9% 1.9% 9.0% 2.8% 26.4% 2.3% 2.3% 0.8% 0.3% 1.3% 0.0% 8.1% 0.5% 0.0% 0.0% 2022 Masters 16.3% 10.9% 16.2% 1.5% 10.1% 2.6% 27.0% 2.3% 1.2% 0.4% 0.1% 1.0% 0.0% 6.4% 1.0% 0.0% 1.4% State OH OH OH OH OH OH OH OH OH OH OH OH OH OH OH OH OH College Program Type Biology Biology Biology Biology Biology Biology Biology Biology Biology Biology Biology Biology Biology Biology Biology Biology Biology Ohio State University-Main Campus University of Cincinnati-Main Campus Miami University-Oxford Ohio University-Main Campus University of Toledo Kent State University at Kent Case Western Reserve University Bowling Green State University-Main Campus University of Akron Main Campus Cleveland State University University of Dayton Youngstown State University The College of Wooster Wright State University-Main Campus John Carroll University Oberlin College Ashland University Public, 4-year Public, 4-year Public, 4-year Public, 4-year Public, 4-year Public, 4-year Private Public, 4-year Public, 4-year Public, 4-year Private Public, 4-year Private Public, 4-year Private Private Private
IN, OH, MI, Private College Program Completion Top / bottom Reports Top Program Completion Counts 2020-2022 Michigan Health Michigan Health Professions Raw Professions Raw Data/numbers Data/numbers 3-Year Bachelors Change 28 2 111 -49 73 -15 -51 -42 -26 -57 -12 80 -14 -83 52 -77 -19 -14 3-Year Masters Change -26 45 -5 -1 47 -31 77 -90 29 33 -41 36 26 14 6 30 -6 -5 2020 Bachelors 852 653 494 606 290 362 398 361 336 346 286 191 274 327 165 251 183 119 2021 Bachelors 858 655 649 709 316 417 432 336 331 300 274 297 297 312 184 233 193 127 2022 Bachelors 880 655 605 557 363 347 347 319 310 289 274 271 260 244 217 174 164 105 2020 Masters 152 230 278 167 383 93 225 335 24 103 124 44 130 46 7 191 39 34 2021 Masters 90 256 272 165 427 95 348 267 84 125 105 75 151 38 7 224 29 30 2022 Masters 126 275 273 166 430 62 302 245 53 136 83 80 156 60 13 221 33 29 State College Program Health Prof. Health Prof. Health Prof. Health Prof. Health Prof. Health Prof. Health Prof. Health Prof. Health Prof. Health Prof. Health Prof. Health Prof. Health Prof. Health Prof. Health Prof. Health Prof. Health Prof. Health Prof. Type MI MI MI MI MI MI MI MI MI MI MI MI MI MI MI MI MI MI Oakland University Grand Valley State University Wayne State University Eastern Michigan University University of Michigan-Ann Arbor University of Michigan-Flint Western Michigan University Michigan State University Baker College Saginaw Valley State University Davenport University Madonna University University of Detroit Mercy Ferris State University Northern Michigan University Central Michigan University Siena Heights University Calvin University Public, 4-year Public, 4-year Public, 4-year Public, 4-year Public, 4-year Public, 4-year Public, 4-year Public, 4-year Private Public, 4-year Private Private Private Public, 4-year Public, 4-year Public, 4-year Private Private
IN, OH, MI, Private College Program Completion Top / bottom Reports Top Program Completion Market Share Percentages 2020-2022 Michigan Health Michigan Health Professions Market Professions Market Shares Shares 3-Year Bachelors Change 0.6% 0.2% 1.7% -0.5% 1.1% -0.6% -0.1% -0.5% -0.3% -0.7% -0.1% 1.2% -0.1% -1.1% 0.8% 3-Year Masters Change -1.3% 0.7% -1.1% -0.6% 0.2% 1.7% -1.3% -3.9% 0.8% 0.7% -1.7% 1.0% 0.4% 0.3% 0.2% 2020 Bachelors 12.1% 9.3% 7.0% 8.6% 4.1% 5.7% 5.1% 5.1% 4.8% 4.9% 4.1% 2.7% 3.9% 4.6% 2.3% 2021 Bachelors 11.5% 8.8% 8.7% 9.5% 4.2% 5.8% 5.6% 4.5% 4.4% 4.0% 3.7% 4.0% 4.0% 4.2% 2.5% 2022 Bachelors 12.7% 9.5% 8.8% 8.1% 5.3% 5.0% 5.0% 4.6% 4.5% 4.2% 4.0% 3.9% 3.8% 3.5% 3.1% 2020 Masters 5.3% 7.9% 9.6% 5.8% 13.2% 7.8% 3.2% 11.6% 0.8% 3.6% 4.3% 1.5% 4.5% 1.6% 0.2% 2021 Masters 2.8% 7.9% 8.4% 5.1% 13.2% 10.7% 2.9% 8.2% 2.6% 3.9% 3.2% 2.3% 4.7% 1.2% 0.2% 2022 Masters 3.9% 8.6% 8.5% 5.2% 13.5% 9.4% 1.9% 7.7% 1.7% 4.3% 2.6% 2.5% 4.9% 1.9% 0.4% State College Program Health Prof. Health Prof. Health Prof. Health Prof. Health Prof. Health Prof. Health Prof. Health Prof. Health Prof. Health Prof. Health Prof. Health Prof. Health Prof. Health Prof. Health Prof. Type MI MI MI MI MI MI MI MI MI MI MI MI MI MI MI Oakland University Grand Valley State University Wayne State University Eastern Michigan University University of Michigan-Ann Arbor Western Michigan University University of Michigan-Flint Michigan State University Baker College Saginaw Valley State University Davenport University Madonna University University of Detroit Mercy Ferris State University Northern Michigan University Public, 4-year Public, 4-year Public, 4-year Public, 4-year Public, 4-year Public, 4-year Public, 4-year Public, 4-year Private Public, 4-year Private Private Private Public, 4-year Public, 4-year
IN, OH, MI, Private College Program Completion Top / bottom Reports Top Program Completion Counts 2020-2022 Indiana Computer and CIS Raw Data/numbers Indiana Computer and CIS Raw Data/numbers 3-Year Bachelors Change 3-Year Masters Change 2020 Bachelors 2021 Bachelors 2022 Bachelors 2020 Masters 2021 Masters 2022 Masters State College Program Type Trine University-Regional/Non-Traditional Campuses IN 783 828 836 53 126 134 117 -9 Computers-CIS Public, 4-year IN Indiana Wesleyan University-National & Global 637 613 559 -78 105 133 96 -9 Computers-CIS Public, 4-year IN IN IN IN IN IN IN IN IN IN IN IN Anderson University Bethel University Butler University Calumet College of Saint Joseph DePauw University Earlham College Franklin College Goshen College Grace College and Theological Seminary Hanover College Huntington University Indiana Institute of Technology Indiana Institute of Technology-College of Professional Studies Indiana Wesleyan University-Marion 166 247 135 72 82 76 73 54 37 55 43 27 273 249 121 68 94 68 67 51 35 59 41 15 328 245 145 89 78 73 59 48 36 36 36 33 162 -2 10 17 -4 -3 -14 -6 -1 -19 -7 6 142 57 204 81 213 50 71 -7 Computers-CIS Computers-CIS Computers-CIS Computers-CIS Computers-CIS Computers-CIS Computers-CIS Computers-CIS Computers-CIS Computers-CIS Computers-CIS Computers-CIS Public, 4-year Public, 4-year Private Private Public, 4-year Public, 4-year Public, 4-year Public, 4-year Private Private Public, 4-year Public, 4-year 15 42 10 21 58 29 11 50 15 -4 8 5 12 0 22 0 12 0 0 0 IN IN 32 33 21 32 27 23 -5 -10 Computers-CIS Computers-CIS Private Public, 4-year
IN, OH, MI, Private College Program Completion Top / bottom Reports Top Program Completion Market Share Percentages 2020-2022 Indiana Computer and CIS market share Indiana Computer and CIS market share 3-Year Bachelors Change 3-Year Masters Change 2020 Bachelors 2021 Bachelors 2022 Bachelors 2020 Masters 2021 Masters 2022 Masters State College Program Type IN Anderson University Indiana Wesleyan University-National & Global Purdue University-Main Campus Bethel University Earlham College Rose-Hulman Institute of Technology Franklin College University of Southern Indiana Huntington University DePauw University Taylor University Butler University Calumet College of Saint Joseph Goshen College 28.8% 29.2% 29.3% 0.5% 21.0% 17.0% 17.4% -3.6% Computers-CIS Private IN IN IN IN IN IN IN IN IN IN IN IN IN 6.1% 9.1% 5.0% 2.6% 3.0% 2.8% 2.7% 2.0% 1.4% 2.0% 1.6% 1.0% 1.2% 9.6% 8.8% 4.3% 2.4% 3.3% 2.4% 2.4% 1.8% 1.2% 2.1% 1.4% 0.5% 0.7% 11.5% 8.6% 5.1% 3.1% 2.7% 2.6% 2.1% 1.7% 1.3% 1.3% 1.3% 1.2% 0.9% 5.4% -0.5% 0.1% 0.5% -0.3% -0.2% -0.6% -0.3% -0.1% -0.8% -0.3% 0.2% -0.2% 23.6% 9.5% 0.0% 0.0% 2.5% 7.0% 1.7% 0.0% 0.0% 0.0% 2.0% 0.0% 0.0% 25.9% 10.3% 0.0% 0.0% 2.7% 7.4% 3.7% 0.0% 0.0% 0.0% 2.8% 0.0% 0.0% 31.6% 7.4% 0.0% 0.0% 1.6% 7.4% 2.2% 0.0% 0.0% 0.0% 1.8% 0.0% 0.0% 8.0% -2.1% 0.0% 0.0% -0.9% 0.4% 0.6% 0.0% 0.0% 0.0% -0.2% 0.0% 0.0% Computers-CIS Private Computers-CIS Public, 4-year Computers-CIS Private Computers-CIS Private Computers-CIS Private Computers-CIS Private Computers-CIS Public, 4-year Computers-CIS Private Computers-CIS Private Computers-CIS Private Computers-CIS Private Computers-CIS Private Computers-CIS Private
IN, OH, MI, Private College Program Completion Top / bottom Reports Top Program Completion Counts 2020-2022 Ohio Computer & CIS Raw Data/numbers Ohio Computer & CIS Raw Data/numbers 3-Year Bachelors Change 108 3 12 4 -1 -13 5 22 -14 18 -37 7 -23 -9 3-Year Masters Change -32 -19 -4 -1 3 19 -6 12 155 -6 10 8 -10 0 2020 Bachelors 270 165 131 120 116 115 87 67 96 61 113 39 63 45 2021 Bachelors 297 172 131 128 112 113 130 78 102 73 102 34 28 34 2022 Bachelors 378 168 143 124 115 102 92 89 82 79 76 46 40 36 2020 Masters 312 115 11 39 62 2021 Masters 353 114 13 58 54 2022 Masters 280 96 7 38 65 19 12 24 234 7 20 136 16 College Program Type Public, 4-year Public, 4-year Public, 4-year Private Public, 4-year Public, 4-year Public, 4-year Private Public, 4-year Public, 4-year Public, 4-year Private Public, 4-year Public, 4-year University of Cincinnati-Main Campus Kent State University at Kent Miami University-Oxford Case Western Reserve University Wright State University-Main Campus Ohio State University-Main Campus University of Akron Main Campus Franklin University Cleveland State University Youngstown State University Ohio University-Main Campus University of Dayton University of Toledo Bowling Green State University-Main Campus Computers-CIS Computers-CIS Computers-CIS Computers-CIS Computers-CIS Computers-CIS Computers-CIS Computers-CIS Computers-CIS Computers-CIS Computers-CIS Computers-CIS Computers-CIS Computers-CIS 18 12 79 13 10 128 26 0 6 17 78 9 21 237 0
IN, OH, MI, Private College Program Completion Top / bottom Reports Top Program Completion Market Share Percentages 2020-2022 Ohio Computer & CIS Ohio Computer & CIS Market Share Market Share 3-Year Bachelors Change 4.4% -0.5% 0.1% -0.3% -0.5% -1.1% -0.1% 0.8% -1.1% 0.7% -2.3% 0.2% -1.4% 3-Year Masters Change -8.0% -3.7% -0.6% -0.7% -0.6% 1.9% -0.9% 1.0% 14.6% -0.8% 0.9% -1.1% -1.4% 2020 Bachelors 14.8% 9.0% 7.2% 6.6% 6.3% 6.3% 4.8% 3.7% 5.3% 3.3% 6.2% 2.1% 3.4% 2021 Bachelors 15.5% 9.0% 6.8% 6.7% 5.9% 5.9% 6.8% 4.1% 5.3% 3.8% 5.3% 1.8% 1.5% 2022 Bachelors 19.1% 8.5% 7.2% 6.3% 5.8% 5.2% 4.7% 4.5% 4.2% 4.0% 3.9% 2.3% 2.0% 2020 Masters 36.6% 13.5% 1.3% 4.6% 7.3% 0.0% 2.1% 1.4% 9.3% 1.5% 1.2% 15.0% 3.1% 2021 Masters 35.4% 11.4% 1.3% 5.8% 5.4% 0.0% 0.6% 1.7% 7.8% 0.9% 2.1% 23.8% 0.0% 2022 Masters 28.6% 9.8% 0.7% 3.9% 6.6% 1.9% 1.2% 2.4% 23.9% 0.7% 2.0% 13.9% 1.6% State OH OH OH OH OH OH OH OH OH OH OH OH OH College Program Type Public, 4-year Public, 4-year Public, 4-year Private Public, 4-year Public, 4-year Public, 4-year Private Public, 4-year Public, 4-year Public, 4-year Private Public, 4-year University of Cincinnati-Main Campus Kent State University at Kent Miami University-Oxford Case Western Reserve University Wright State University-Main Campus Ohio State University-Main Campus University of Akron Main Campus Franklin University Cleveland State University Youngstown State University Ohio University-Main Campus University of Dayton University of Toledo Computers-CIS Computers-CIS Computers-CIS Computers-CIS Computers-CIS Computers-CIS Computers-CIS Computers-CIS Computers-CIS Computers-CIS Computers-CIS Computers-CIS Computers-CIS
IN, OH, MI, Private College Program Completion Top / bottom Reports Top Program Completion Counts 2020-2022 Michigan CIS Raw Data/numbers Michigan CIS Raw Data/numbers 3-Year Bachelors Change 39 15 21 8 18 39 1 -33 16 -49 -38 -22 -8 20 3-Year Masters Change 156 -5 3 -7 -13 5 9 -8 9 -2 -14 5 3 -24 2020 Bachelors 1117 308 155 156 141 106 136 166 90 142 113 91 68 35 2021 Bachelors 1142 321 170 160 135 119 140 127 90 142 91 94 70 47 2022 Bachelors 1156 323 176 164 159 145 137 133 106 93 75 69 60 55 2020 Masters 236 26 63 46 25 75 33 29 10 3 25 87 5 37 2021 Masters 291 37 64 37 19 80 33 24 26 6 24 114 12 21 2022 Masters 392 21 66 39 12 80 42 21 19 1 11 92 8 13 State College Program Type MI MI MI MI MI MI MI MI MI MI MI MI MI MI University of Michigan-Ann Arbor Michigan State University Oakland University Wayne State University Eastern Michigan University University of Michigan-Dearborn Davenport University Grand Valley State University Michigan Technological University Baker College Western Michigan University Central Michigan University Ferris State University University of Michigan-Flint Computers-CIS Computers-CIS Computers-CIS Computers-CIS Computers-CIS Computers-CIS Computers-CIS Computers-CIS Computers-CIS Computers-CIS Computers-CIS Computers-CIS Computers-CIS Computers-CIS Public, 4-year Public, 4-year Public, 4-year Public, 4-year Public, 4-year Public, 4-year Private Public, 4-year Public, 4-year Private Public, 4-year Public, 4-year Public, 4-year Public, 4-year
IN, OH, MI, Private College Program Completion Top / bottom Reports Top Program Completion Market Share Percentages 2020-2022 Michigan CIS Market Shares Michigan CIS Market Shares 3-Year Bachelors Change 0.3% 0.2% 0.5% 0.1% 0.4% 1.1% -0.1% -1.2% 0.4% -1.6% -1.3% -0.8% -0.3% 3-Year Masters Change 13.1% -1.0% -0.7% -1.6% -1.9% -0.7% 0.4% -1.4% 0.8% -0.3% -2.0% -0.9% 0.2% 2020 Bachelors 35.8% 9.9% 5.0% 5.0% 4.5% 3.4% 4.4% 5.3% 2.9% 4.5% 3.6% 2.9% 2.2% 2021 Bachelors 35.8% 10.1% 5.3% 5.0% 4.2% 3.7% 4.4% 4.0% 2.8% 4.5% 2.9% 2.9% 2.2% 2022 Bachelors 36.0% 10.1% 5.5% 5.1% 5.0% 4.5% 4.3% 4.1% 3.3% 2.9% 2.3% 2.2% 1.9% 2020 Masters 30.0% 3.3% 8.0% 5.8% 3.2% 9.5% 4.2% 3.7% 1.3% 0.4% 3.2% 11.1% 0.6% 2021 Masters 32.7% 4.2% 7.2% 4.2% 2.1% 9.0% 3.7% 2.7% 2.9% 0.7% 2.7% 12.8% 1.3% 2022 Masters 43.1% 2.3% 7.3% 4.3% 1.3% 8.8% 4.6% 2.3% 2.1% 0.1% 1.2% 10.1% 0.9% State College Program Type MI MI MI MI MI MI MI MI MI MI MI MI MI University of Michigan-Ann Arbor Michigan State University Oakland University Wayne State University Eastern Michigan University University of Michigan-Dearborn Davenport University Grand Valley State University Michigan Technological University Baker College Western Michigan University Central Michigan University Ferris State University Computers-CIS Computers-CIS Computers-CIS Computers-CIS Computers-CIS Computers-CIS Computers-CIS Computers-CIS Computers-CIS Computers-CIS Computers-CIS Computers-CIS Computers-CIS Public, 4-year Public, 4-year Public, 4-year Public, 4-year Public, 4-year Public, 4-year Private Public, 4-year Public, 4-year Private Public, 4-year Public, 4-year Public, 4-year
The biology raw numbers and market share data in the next slides was released in an earlier version of the TOP-bottom reports
IN, OH, MI, Private College Program Completion Top / bottom Reports 2022 Bachelors Top 15 Indiana Biology market share Indiana Biology market share Bachelors Bachelors 3-Year Bachelors Change -2.4% 8.9% 0.7% -0.9% -0.9% -0.3% 0.0% 0.7% -1.3% -0.1% -0.3% -0.5% 0.3% -0.6% -0.4% 3-Year Masters Change -0.3% 2.8% -2.5% 2.4% -2.1% 0.0% 0.0% -1.4% -1.8% 0.0% 0.0% 0.0% 0.0% 0.0% -0.4% 2020 Bachelors 26.0% 10.9% 7.9% 9.2% 5.8% 2.8% 2.3% 1.5% 3.3% 2.0% 2.1% 2.1% 1.3% 2.1% 1.8% 2021 Bachelors 28.4% 14.6% 8.0% 8.0% 4.8% 2.1% 2.4% 1.8% 2.3% 1.7% 1.6% 1.9% 1.3% 2.2% 1.4% 2022 Bachelors 23.6% 19.8% 8.6% 8.3% 4.9% 2.5% 2.3% 2.2% 1.9% 1.8% 1.8% 1.6% 1.6% 1.6% 1.4% 2020 Masters 4.8% 7.3% 39.7% 1.3% 8.6% 0.0% 0.0% 4.8% 3.8% 0.0% 0.0% 0.0% 0.0% 0.0% 3.2% 2021 Masters 3.8% 7.0% 41.1% 3.5% 10.1% 0.0% 0.0% 3.8% 4.1% 0.0% 0.0% 0.0% 0.0% 0.0% 1.3% 2022 Masters 4.5% 10.1% 37.2% 3.7% 6.5% 0.0% 0.0% 3.4% 2.0% 0.0% 0.0% 0.0% 0.0% 0.0% 2.8% State IN IN IN IN IN IN IN IN IN IN IN IN IN IN IN College Marian University Manchester University University of Notre Dame University of Indianapolis Valparaiso University Anderson University Bethel University Butler University Calumet College of Saint Joseph DePauw University Earlham College Franklin College Goshen College Grace College and Theological Seminary Hanover College Program Type Biology Private Biology Private Biology Private Biology Private Biology Private Biology Private Biology Private Biology Private Biology Private Biology Private Biology Private Biology Private Biology Private Biology Private Biology Private
IN, OH, MI, Private College Program Completion Top / bottom Reports 2022 Masters Top 15 Indiana Biology market share Indiana Biology market share 3-Year Bachelors Change -2.4% 8.9% 3-Year Masters Change -0.3% 2.8% 2020 Bachelors 26.0% 10.9% 2021 Bachelors 28.4% 14.6% 2022 Bachelors 23.6% 19.8% 2020 Masters 4.8% 7.3% 2021 Masters 3.8% 7.0% 2022 Masters 4.5% 10.1% State IN IN College University of Notre Dame Indiana Wesleyan University-Marion Program Type Biology Biology Private Private Public, 4- year Private Private Private Private Private Private Private Private Private IN IN IN IN IN IN IN IN IN IN Indiana University-East Manchester University Valparaiso University Marian University University of Indianapolis Butler University Hanover College Calumet College of Saint Joseph Indiana Institute of Technology Martin University 7.9% 9.2% 5.8% 2.8% 2.3% 1.5% 3.3% 2.0% 2.1% 2.1% 8.0% 8.0% 4.8% 2.1% 2.4% 1.8% 2.3% 1.7% 1.6% 1.9% 8.6% 8.3% 4.9% 2.5% 2.3% 2.2% 1.9% 1.8% 1.8% 1.6% 0.7% -0.9% -0.9% -0.3% 0.0% 0.7% -1.3% -0.1% -0.3% -0.5% 39.7% 1.3% 8.6% 0.0% 0.0% 4.8% 3.8% 0.0% 0.0% 0.0% 41.1% 3.5% 10.1% 0.0% 0.0% 3.8% 4.1% 0.0% 0.0% 0.0% 37.2% 3.7% 6.5% 0.0% 0.0% 3.4% 2.0% 0.0% 0.0% 0.0% -2.5% 2.4% -2.1% 0.0% 0.0% -1.4% -1.8% 0.0% 0.0% 0.0% Biology Biology Biology Biology Biology Biology Biology Biology Biology Biology Public, 4- year Private Private Private Private Private Private IN IN IN IN IN IN IN Purdue University Northwest Anderson University Bethel University DePauw University Earlham College Franklin College Goshen College 1.3% 2.1% 1.8% 1.6% 1.5% 1.2% 1.3% 1.3% 2.2% 1.4% 1.5% 1.2% 0.9% 1.3% 1.6% 1.6% 1.4% 1.4% 1.2% 1.1% 1.0% 0.3% -0.6% -0.4% -0.3% -0.2% -0.1% -0.3% 0.0% 0.0% 3.2% 0.0% 0.0% 0.0% 14.9% 0.0% 0.0% 1.3% 0.0% 0.0% 0.9% 15.5% 0.0% 0.0% 2.8% 0.0% 0.0% 1.4% 15.8% 0.0% 0.0% -0.4% 0.0% 0.0% 1.4% 0.9% Biology Biology Biology Biology Biology Biology Biology
IN, OH, MI, Private College Program Completion Top / bottom Reports 2022 Bachelors Top 15 Ohio Biology Raw Data/numbers Ohio Biology Raw Data/numbers 3-Year Bachelors Change -69 68 3 -49 88 -17 63 -9 2 21 -13 -5 -6 -20 3 1 3-Year Masters Change 5 8 -63 5 36 3 41 2 0 1 -3 4 2020 Bachelors 1042 382 268 288 124 223 127 138 110 86 106 97 91 102 73 67 2021 Bachelors 959 396 278 310 125 224 160 131 102 95 121 103 75 122 70 74 2022 Bachelors 973 450 271 239 212 206 190 129 112 107 93 92 85 82 76 68 2020 Masters 146 93 213 9 58 21 209 19 11 3 4 5 2021 Masters 133 82 157 17 79 25 232 20 20 7 3 11 2022 Masters 151 101 150 14 94 24 250 21 11 4 1 9 State College Program Type Biology Biology Biology Biology Biology Biology Biology Biology Biology Biology Biology Biology Biology Biology Biology Biology OH OH OH OH OH OH OH OH OH OH OH OH OH OH OH OH Ohio State University-Main Campus University of Cincinnati-Main Campus Miami University-Oxford Ohio University-Main Campus University of Toledo Kent State University at Kent Case Western Reserve University Bowling Green State University-Main Campus University of Akron Main Campus Cleveland State University University of Dayton Youngstown State University The College of Wooster Wright State University-Main Campus John Carroll University Oberlin College Public, 4-year Public, 4-year Public, 4-year Public, 4-year Public, 4-year Public, 4-year Private Public, 4-year Public, 4-year Public, 4-year Private Public, 4-year Private Public, 4-year Private Private 78 6 71 4 59 9 -19 3
IN, OH, MI, Private College Program Completion Top / bottom Reports 2022 Masters Top 15 Ohio Biology Market Share Ohio Biology Market Share 3-Year Bachelors Change 1.4% -2.1% 0.0% 1.4% 2.0% -0.5% -0.5% -0.3% 0.0% -1.3% 0.3% 0.0% -0.2% 0.0% 0.5% -0.3% -0.2% 3-Year Masters Change 3.3% -0.3% -8.0% 0.4% 3.6% -2.5% 0.2% 0.1% 1.6% 0.5% 0.7% -0.1% 0.4% 0.3% 0.1% -0.3% 0.0% 2020 Bachelors 3.0% 24.7% 6.4% 9.1% 2.9% 2.4% 5.3% 3.3% 0.0% 6.8% 1.2% 2.6% 2.3% 1.7% 2.0% 2.5% 2.2% 2021 Bachelors 3.7% 22.4% 6.5% 9.3% 2.9% 2.9% 5.2% 3.1% 0.0% 7.3% 1.1% 2.4% 2.4% 1.6% 2.2% 2.8% 1.8% 2022 Bachelors 4.4% 22.7% 6.3% 10.5% 4.9% 1.9% 4.8% 3.0% 0.0% 5.6% 1.5% 2.6% 2.1% 1.8% 2.5% 2.2% 2.0% 2020 Masters 23.7% 16.6% 24.1% 10.5% 6.6% 8.8% 2.4% 2.2% 0.1% 1.0% 0.7% 1.2% 0.6% 0.7% 0.3% 0.5% 0.0% 2021 Masters 26.4% 15.1% 17.9% 9.3% 9.0% 8.1% 2.8% 2.3% 1.9% 1.9% 0.0% 2.3% 1.3% 0.5% 0.8% 0.3% 0.0% 2022 Masters 27.0% 16.3% 16.2% 10.9% 10.1% 6.4% 2.6% 2.3% 1.7% 1.5% 1.4% 1.2% 1.0% 1.0% 0.4% 0.1% 0.0% State OH OH OH OH OH OH OH OH OH OH OH OH OH OH OH OH OH College Program Type Biology Biology Biology Biology Biology Biology Biology Biology Biology Biology Biology Biology Biology Biology Biology Biology Biology Case Western Reserve University Ohio State University-Main Campus Miami University-Oxford University of Cincinnati-Main Campus University of Toledo Wright State University-Main Campus Kent State University at Kent Bowling Green State University-Main Campus Northeast Ohio Medical University Ohio University-Main Campus Ashland University University of Akron Main Campus Youngstown State University John Carroll University Cleveland State University University of Dayton The College of Wooster Private Public, 4-year Public, 4-year Public, 4-year Public, 4-year Public, 4-year Public, 4-year Public, 4-year Public, 4-year Public, 4-year Private Public, 4-year Public, 4-year Private Public, 4-year Private Private
IN, OH, MI, Private College Program Completion Top / bottom Reports 2022 Bachelors Top 15 Michigan Biology Raw Data/numbers Michigan Biology Raw Data/numbers 3-Year Bachelors Change 152 91 40 23 13 -76 -19 -5 20 4 -2 13 -12 6 -10 25 4 3-Year Masters Change -8 -70 -7 7 3 -15 -10 -1 2020 Bachelors 1078 683 415 178 171 237 176 130 104 118 115 82 102 64 79 39 49 2021 Bachelors 1229 757 458 202 183 219 153 112 152 137 126 84 89 69 44 70 44 2022 Bachelors 1230 774 455 201 184 161 157 125 124 122 113 95 90 70 69 64 53 2020 Masters 72 299 65 56 26 41 31 10 2021 Masters 79 252 59 47 19 31 25 10 2022 Masters 64 229 58 63 29 26 21 9 State College Program Biology Biology Biology Biology Biology Biology Biology Biology Biology Biology Biology Biology Biology Biology Biology Biology Biology Type MI MI MI MI MI MI MI MI MI MI MI MI MI MI MI MI MI Michigan State University University of Michigan-Ann Arbor Grand Valley State University Wayne State University Oakland University Central Michigan University Western Michigan University Northern Michigan University University of Detroit Mercy University of Michigan-Dearborn Eastern Michigan University University of Michigan-Flint Ferris State University Calvin University Saginaw Valley State University Kalamazoo College Hope College Public, 4-year Public, 4-year Public, 4-year Public, 4-year Public, 4-year Public, 4-year Public, 4-year Public, 4-year Private Public, 4-year Public, 4-year Public, 4-year Public, 4-year Private Public, 4-year Private Private 26 9 32 5 25 3 -1 -6
IN, OH, MI, Private College Program Completion Top / bottom Reports 2022 Masters Top 15 Michigan Biology Market Shares Michigan Biology Market Shares 3-Year Bachelors Change 1.2% 2.0% 0.3% 0.4% 0.1% -2.0% -0.2% -0.7% -0.2% -0.3% 0.2% -0.1% 0.2% -0.1% -0.1% 0.0% 0.1% 3-Year Masters Change -3.9% 0.7% 2.9% 0.7% 1.3% -1.5% 0.6% -0.9% 1.2% 0.1% -0.8% -0.4% 0.0% 0.0% 0.0% 0.0% 0.0% 3-Year Masters Change Biology Biology Biology Biology Biology Biology Biology Biology Biology Biology Biology Biology Biology Biology Biology Biology Biology 2020 Bachelors 16.4% 25.9% 4.3% 10.0% 4.1% 5.7% 2.8% 4.2% 0.7% 3.1% 2.0% 0.6% 0.5% 1.0% 0.8% 0.3% 1.5% 2021 Bachelors 16.8% 27.3% 4.5% 10.2% 4.1% 4.9% 2.8% 3.4% 0.8% 2.5% 1.9% 0.9% 0.6% 1.2% 0.7% 0.2% 1.5% 2022 Bachelors 17.6% 27.9% 4.6% 10.3% 4.2% 3.7% 2.6% 3.6% 0.6% 2.8% 2.2% 0.6% 0.7% 0.8% 0.7% 0.4% 1.6% 2020 Masters 45.6% 11.0% 8.5% 9.9% 4.0% 6.3% 4.0% 4.7% 2.3% 1.5% 1.4% 0.8% 0.0% 0.0% 0.0% 0.0% 0.0% 2021 Masters 43.4% 13.6% 8.1% 10.2% 3.3% 5.3% 5.5% 4.3% 2.9% 1.7% 0.9% 0.7% 0.0% 0.0% 0.0% 0.0% 0.0% 2022 Masters 41.8% 11.7% 11.5% 10.6% 5.3% 4.7% 4.6% 3.8% 3.5% 1.6% 0.5% 0.4% 0.0% 0.0% 0.0% 0.0% 0.0% State College Program Public, 4-year Public, 4-year Public, 4-year Public, 4-year Public, 4-year Public, 4-year Public, 4-year Public, 4-year Public, 4-year Public, 4-year Public, 4-year Private Private Private Private Private Private MI MI MI MI MI MI MI MI MI MI MI MI MI MI MI MI MI University of Michigan-Ann Arbor Michigan State University Wayne State University Grand Valley State University Oakland University Central Michigan University Eastern Michigan University Western Michigan University Michigan Technological University Northern Michigan University University of Michigan-Flint Andrews University Adrian College Albion College Alma College Aquinas College Calvin University
2024 College Viability 2024 College Viability Program Completion Apps Program Completion Apps 2,500 public and private colleges in 16 IPEDS programs 1. Biology 2. Business, Management and Marketing 3. Communications& Journalism 4. Computers and CIS 5. Education 6. Health Professions 7. Homeland Security 8. Liberal Arts 9. Liberal Arts 10. Math & Statistics 11. Parks & Recreation 12. Philosophy & Religion 13. Physical Sciences 14. Psychology 15. Public Administration 16. Social Sciences 17. Visual & Performing Arts
2024 College Viability Apps 2024 College Viability Apps Private College Versions Colleges Reported: 1,297 Public College Versions (2 & 4 year) Colleges Reported: 1,579 Executive Analysis version 32 reports Executive Analysis version 35 reports Faculty and Staff version 8 reports Faculty and Staff version 10 reports Student & Family version 5 reports Student & Family version 6 reports
What can you do with these data comparisons? 1. Use the IPEDS program completions data to see which public or private colleges have programs with strong completion rates. 2. While quantity does not always reflect quality, it is a reasonable indicator that a college will keep higher-enrolled programs and majors. 3. Lower-enrolled programs and majors are at increasing risk of being eliminated. While most colleges allow currently enrolled students to complete their programs, the risk of decreasing quality increases with each passing year as faculty and other leave the college.