Private Equity Performance Analysis: CalPERS Investments Overview
Explore the performance of CalPERS' private equity investments, comparing them to the stock market, and delving into measurement methods and pension fund performance metrics in this insightful presentation by Eileen Appelbaum and Rosemary Batt.
Download Presentation

Please find below an Image/Link to download the presentation.
The content on the website is provided AS IS for your information and personal use only. It may not be sold, licensed, or shared on other websites without obtaining consent from the author. If you encounter any issues during the download, it is possible that the publisher has removed the file from their server.
You are allowed to download the files provided on this website for personal or commercial use, subject to the condition that they are used lawfully. All files are the property of their respective owners.
The content on the website is provided AS IS for your information and personal use only. It may not be sold, licensed, or shared on other websites without obtaining consent from the author.
E N D
Presentation Transcript
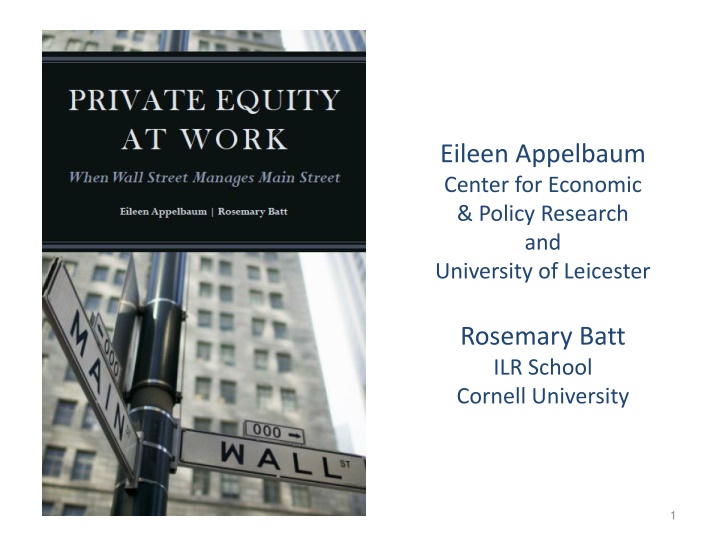
Eileen Appelbaum Center for Economic & Policy Research and University of Leicester Rosemary Batt ILR School Cornell University 1
Prologue: Performance of CalPERS Private Equity Investments Investments in private equity are riskier than investments in public equities (the stock market) They should have higher returns than stocks (beat the market) not just high absolute returns Median PE fund beat stock market 1995-2005 but not in last decade CalPERS PE investments haven t beaten its stock market benchmark in YTD, 3-year, 5-year and 10-year windows Despite high absolute returns, CalPERS would have done better in the last decade by investing in stock market index fund 2
Overview of Presentation Private equity performance Measurement Persistence CalPERS performance PE Fees: Why the house never loses 3
Measuring Pension Fund Performance Internal Rate of Return (IRR) is a flawed measure Academic researchers and many financial firms (e.g., Goldman Sachs) use Public Market Equivalent (PME) PME compares an investment in a PE fund to an equivalently timed investment in the relevant public equity market (e.g., S&P500, Russell 3000) A PME of 1.20 implies that at the end of the fund s life, investors will earn 20% more than if they had invested in the stock market If fund has 10-year life span, outperformance is less than 2%/year 4
Pension Fund Performance Harris, Jenkinson & Kaplan (2014) PME compared to S&P 500 Buyout Funds PMEs Vintage Average Median Wtd. Average 2000-08 average 1.27 1.25 1.29 Sample average 1.22 1.16 1.27 PME compared to S&P 500, Russell 3000, Russell 2000 Buyout Funds PMEs Vintage S&P 500 Russell 3000 Russell 2000 2000-08 average 1.27 1.25 1.28 Sample average 1.20 1.18 1.11 Sample median 1.11 1.09 1.02 5
Pension Fund Performance Harris, Jenkinson & Kaplan (2014) Things to note: Data are from only LPs that use Burgiss system to track performance In the 2000 08 vintages, a large majority of investments by the median fund had not been realized at time of analysis Difference between average and median in sample average driven by top performers PME shows performance over the life of the fund If funds have 10 year life span, PME of 1.27 is outperformance of 2.4% a year PME of 1.11% is outperformance of just over 1% a year If Russell 2000 is right benchmark, investors in half the funds in sample would have done better in stock market 6
Performance of Fully Liquidated Funds Source: Robinson and Sensoy (2011, 2013), Tables 2, A-2* S&P PME Tailored PME** Mean Median 25th %ile 1.18 1.09 1.10 1.00 0.82 0.77 75% %ile 1.46 1.37 * Data: 368 pre-vintage year 2006 funds, liquidated by 6/302010 ** Tailored PME : Fama-French size tercile index according to whether the fund is self-described a small-cap, mid-cap, or large-cap buyout fund 7
Persistence of Performance Likelihood that next funds are in same performance bracket Kaplan and Schoar (2005): pre-2000 Bottom Middle Top Bottom Tercile 49% 31% 20% Middle Tercile 30% 38% 32% Top Tercile 21% 31% 48% Harris, Jenkinson, Kaplan, Stucke (2014): post-2000 4 3 2 1 Bottom Quartile 32% 32% 14% 21% Third Quartile 18% 39% 28% 15% Second Quartile 21% 32% 23% 24% Top Quartile 19% 30% 29% 22% 8
PE Hasnt Beaten Stock Market Since 2005 (PitchBook 3Q2015 Benchmarking Report)
CalPERS Monthly Update Performance & Risk Net Return (Absolute Return) Private Equity FYTD 3-YR 5-YR 10-YR 20-YR As of 6-30-15 8.9% 14.1% 14.4% 11.9% 12.3% As of 8-31-15 3.1% 15.2% 14.9% 12.0% 12.5% Sources https://www.calpers.ca.gov/docs/board-agendas/201508/invest/item04c-03.pdf https://www.calpers.ca.gov/docs/board-agendas/201510/invest/item04c-01.pdf 10
Absolute Returns Wrong Measure for PE Absolute return strategy not appropriate for risky investments No benchmark No adjustment for risk LPs continue to invest in PE based on absolute return measures U.S. stock market has been at or near record highs PE can sell portfolio companies at high prices PE distributions to LPs are high now, but may not beat their benchmark LPs are looking at absolute returns and re-investing in PE CalPERS staff focused on absolute returns at a recent board meeting 12
CalPERS Stock Market Benchmark The CalPERS benchmark comprised of 2/3rds of the FTSE U.S. Total Market Index + 1/3rd of the FTSE All World Total Market Index (ex US) + 300 basis points (outperformance of 3% a year) CalPERS staff are now questioning this benchmark 14
CalPERS Monthly Update Performance & Risk CalPERS Performance Returns vs. Benchmark Private Equity FYTD 3-YR 5-YR 10-YR 20-year As of 6-30-15 -2.21% -2.64% -0.61% -3.00% 0.93% As of 8-31-15 +0.04% -6.13% -2.08% -2.80% 1.20% Sources https://www.calpers.ca.gov/docs/board-agendas/201508/invest/item04c-03.pdf 15 https://www.calpers.ca.gov/docs/board-agendas/201510/invest/item04c-01.pdf
Why the House Never Loses: Management Fees PE collects management fees from LPs & charges expenses to LPs that should be covered by the fees KKR and Capstone Failed transactions Indemnification clauses: settlements with SEC paid out of fund profits, costly but invisible to LPs Management fee waivers GP waives management fees from LPs in exchange for priority claim on profits taken off the top So LPs still paying; money comes out of right pocket instead of left Taxed as capital gains rate benefits GP, but taxpayers are losers Fee waivers circumvent tax code 16
Why the House Never Loses: Advisory Fees PE charges advisory and monitoring fees to portfolio companies Reduces: Resources for growth, price at exit, & LP returns Uses accelerated fees, evergreen fees Illegal use of monitoring fees if services not specified Monitoring fee contract must specify services to be provided Fees must be commensurate with services provided Otherwise, dividends disguised as monitoring fees Fees reduce portfolio company s tax liabilities, dividends don t 17
PE Returns Net of Fees Carried interest is a share of the fund s profit paid to the GP based on fund performance -- > performance or incentive fee Most GPs report returns to LPs net of performance and management fees lack of transparency Without full disclosure of these fees, LPs can t evaluate what GPs are charging for their services or the effect on returns CalPERS estimates that the combined fees [performance fee + management fees] = 7% of pension fund investments in PE 18
Thank You 19

