Probability Distributions, Frequency Tables, and Relative Frequencies
Explore the concepts of probability distributions, frequency tables, and relative frequencies through examples like finding relative frequencies in a music preference survey and calculating probabilities in experimental scenarios involving coins and spinners.

Download Presentation

Please find below an Image/Link to download the presentation.
The content on the website is provided AS IS for your information and personal use only. It may not be sold, licensed, or shared on other websites without obtaining consent from the author. If you encounter any issues during the download, it is possible that the publisher has removed the file from their server.
You are allowed to download the files provided on this website for personal or commercial use, subject to the condition that they are used lawfully. All files are the property of their respective owners.
The content on the website is provided AS IS for your information and personal use only. It may not be sold, licensed, or shared on other websites without obtaining consent from the author.
E N D
Presentation Transcript
13-2 Probability Distributions and Frequency Tables
Frequency Table: a data display that shows how often an item appears in a category Relative Frequency: the ratio of the frequency of the category to the total frequency
Problem 1: Finding Relative Frequencies The results of a survey of students music preferences are organized in the frequency table. What is the relative frequency of preference for rock music? Type of Music Preferred Frequency Rock 10 Hip Hop 7 Country 8 Classical 5 Alternative 6 Other 4
What is the relative frequency of preference for Classical? Country? Type of Music Preferred Frequency Rock 10 Hip Hop 7 Country 8 Classical 5 Alternative 6 Other 4
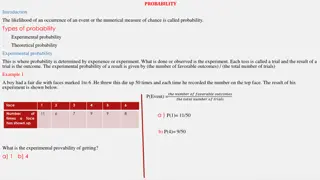
Problem 2: Calculating Probability by using Relative Frequencies A student conducts a probability experiment by tossing 3 coins one after another. Using the results shown, what is the probability that exactly two heads will occur in the next three tosses?
A student conducts a probability experiment by spinning the spinner shown. Using the results in the frequency table, what is the probability of the spinner pointing at 4 on the next spin?
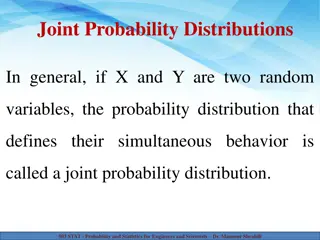
Probability Distribution: shows the probability of each possible outcome Can be shown using a frequency table
Problem 3: Finding Probability Distribution