Probability Scales and Graphs Learning Objectives
Enhance your understanding of probability scales, fractions, decimals, and percentages through interactive activities such as vertical line graphs, pie charts, and placing letters on probability scales. Practice interpreting data and constructing visual representations to improve your grasp on probability concepts.

Download Presentation

Please find below an Image/Link to download the presentation.
The content on the website is provided AS IS for your information and personal use only. It may not be sold, licensed, or shared on other websites without obtaining consent from the author. If you encounter any issues during the download, it is possible that the publisher has removed the file from their server.
You are allowed to download the files provided on this website for personal or commercial use, subject to the condition that they are used lawfully. All files are the property of their respective owners.
The content on the website is provided AS IS for your information and personal use only. It may not be sold, licensed, or shared on other websites without obtaining consent from the author.
E N D
Presentation Transcript
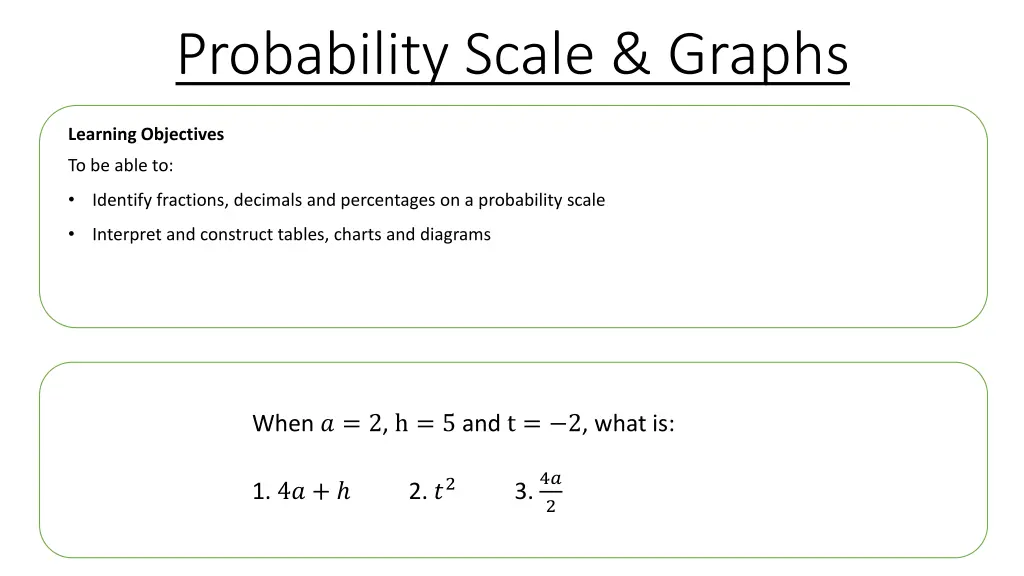
Probability Scale & Graphs Learning Objectives To be able to: Identify fractions, decimals and percentages on a probability scale Interpret and construct tables, charts and diagrams When ? = 2, h = 5 and t = 2, what is: 1. 4? + 2. ?2 3. 4? 2
STARTER Vertical Line Graph Probability Scales You have a bag of 2 red counters and 4 green Numbers of Ice Creams Sold 14 counters. Place an A on the scale where the 12 probability of selecting a red counter would be. 10 Ice Creams Sold 8 0 1 6 4 2 Pie Charts Draw a pie chart for the table below 0 Day 1 Day 2 Day 3 Day 4 Day Favourite Fruit Frequency a) What is the modal day for ice creams sold? b) What is the median number of ice creams Apples 4 Bananas 10 sold? Kiwi 6 Raisin 4
PROBABILITY SCALES Place the letters on the probability scale: A - P(flipping a head on a coin) B - P(rolling a number less than 7 on a dice) C - P(rolling a 5 on a dice) 1 6 4 6 2 6 1 2 5 6 0 1
Your turn: Your turn: Place the letters on the probability scale: A - P(flipping a head or a tail on a coin) B - P(rolling an odd number on a dice) C - P(rolling a number less than 5 on a dice) 0 1 Place these letters on probability scale: A - P(rolling a square number on a dice) B - P(rolling a prime number on a dice)
PIE CHARTS Draw a pie chart to show the favourite colour of 60 year 7 pupils Colour Frequency Red 17 Green 8 Blue 21 Yellow 3 Other 11 Total 60
Your turn Draw a pie chart representing this data: Vegetable Frequency Carrot 13 Radish 17 Marrow 33 Potato 5 Other 4 Total 60 On a pie chart representing people s favourite colours, red is represented by 30 . 5 people said red was their favourite colour. a) How many people were asked in total? b) Blue on the pie chart is 60 . Write down the probability that someone selected at random has blue as a favourite colour.
VERTICAL LINE GRAPHS What is the mode for monthly sales? What is the range? What is the mean & median for the table?
Your turn Cars Sold 25 20 15 Frequency 10 5 0 Monday Tuesday Wednesday Thursday Friday Saturday Sunday Days of the Week 1) a) Find the mode and range of the chart above. b) Find the mean and median of the chart above 2) For every car sold, the dealership makes 15% profit. On Saturday and Sunday the dealership makes 1500 profit. How much money did they sell their cars for on these days?


