Probability Theory in Statistics
In this chapter, we delve into probability theory and its crucial role in inferential statistics. Probability helps us understand unpredictable events and random sampling outcomes. Explore simple probabilities, set theory, and examples illustrating the application of probability in various scenarios.

Download Presentation

Please find below an Image/Link to download the presentation.
The content on the website is provided AS IS for your information and personal use only. It may not be sold, licensed, or shared on other websites without obtaining consent from the author.If you encounter any issues during the download, it is possible that the publisher has removed the file from their server.
You are allowed to download the files provided on this website for personal or commercial use, subject to the condition that they are used lawfully. All files are the property of their respective owners.
The content on the website is provided AS IS for your information and personal use only. It may not be sold, licensed, or shared on other websites without obtaining consent from the author.
E N D
Presentation Transcript
Chapter 6 Probability
Inferential Statistics Samples - so far we have been concerned about describing and summarizing samples or subsets of a population Inferential stats allows us to go beyond our sample and make educated guesses about the population
Inferential Statistics But, we need some help which comes from Probability theory Inferential = Statistics Statistics Theory Descriptive + Probability
What is probability theory and what is its role? Probability theory, or better probability theories are found in mathematics and are interested in questions about unpredictable events Although there is no universal agreement about what probability is, probability helps us with the possible outcomes of random sampling from populations
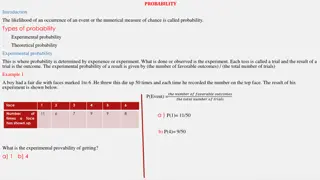
Examples The Chance of Rain The odds of rolling a five at the craps table (or winning at black jack) The chance that a radioactive mass will emit a particle The probability that a coin will come up heads upon flipping it* The probability of getting exactly 2 heads out of 3 flips of a coin* The probability of getting 2 or more heads out of 3 flips*
Set Theory (a brief digression) Experiment - an act which leads to an unpredictable, but measurable outcome Set - a collection of outcomes Event - one possible outcome; a value of a variable being measured Simple probability the likelihood that an event occurs in a single random observation
Simple Probabilities To compute a simple probability (read the probability of some event), p(event): p(event)=Number of equally likely observations of event in the population Number of equally likely observations in the population
Probability Theory Most of us understand probability in terms of a relative frequency measure (remember this, f/n), the frequency of occurrences (f) divided by the total number of trials or observations (n) However, probability theories are about the properties of probability not whether they are true or not (the determination of a probability can come from a variety of sources)
Example 100 marbles are Placed in a jar
Relative Frequency (a reminder) What if we counted all of the marbles in the jar and constructed a frequency distribution? We find 50 black marbles, 25 red marbles, and 5 white marbles Relative frequency (proportion) seems like probability Color f rf Black Red 25 White 25 .25 Total 100 1.00 50 .50 .25
Relative Frequency and Probability Distributions A graphical representation of a relative frequency distribution is also similar to a Probability Distribution 1 Relative Frequency/ 0.8 Probability 0.6 0.4 0.2 0 White Black Red
What does this mean? What will happen if we choose a single marble out of the jar? If we chose 100 marbles from the jar, tallied the color, and replaced them, will we get 50, 25, and 25? If so, what if we selected only 99? If .5, .25, and .25 are the real probabilities, then in the long run will should get relative proportions that are close to .5, .25, and .25
Bernoulli s Theorem The notion of in the long run is attributed to Bernoulli It is also known as the law of large numbers as the number of times an experiment is performed approaches infinity (becomes large), the true probability of any outcome equals the relative proportion
Venn Diagrams A A S
Venn Diagrams A A not red Red S all the marbles
Axiom s of Probability 1. The probability of any event A, denoted p(A), is 0 < p(A) < 1 2. The probability of S, or of an event in sample space S is 1 3. If there is a sequence of mutually exclusive events (B1, B2, B3, etc.) and C represents the event at least one of the Bi s occurs, then the probability of C is the sum of the probabilities of the Bis (p(C) = p(Bi)
1. 0 < p(A) < 1 (in Venn diagrams) A S S A The probability of event A is between 0 and 1
2. p(S) = 1 A The probability of AN event, in S, occurring is 1 S
3. p(C) = p(Bi) If the events B1, B2, B3, etc. are mutually exclusive, the probability of one of the Bs occurring is C, the sum of the Bs B1 B5 C B4 B2 B3 S
Mutually Exclusive Events If A and B are mutually exclusive, meaning that an event of type A precludes event B from occurring, by the 3rd axiom of probability
Mutually Exclusive Events If A and B are mutually exclusive, and set A and set B are not null sets,
Joint Events If the events are independent, (not mutually exclusive), meaning that the occurrence of one does not affect the occurrence of the other, the intersection
Joint Events - Example What is the probability of selecting a black marble and white marble in two successive selections? Since each selection is independent, then p(Black, White) = .5 .25 = .125
Generalization from Joint Events If A, B, C, and D are independent events, then: What is the probability of selecting a white marble, then red, then white, then black?
What if the events are not independent? Conditional probability - the occurrence of one event is influenced by another event Conditional Probability refers to the probability of one event under the condition that the other event is known to have occurred p(A | B) - read the probability of A given that B has occurred
Probability Theory and Hypothesis Testing A man comes up to you on the street and says that he has a special quarter that, when flipped, comes up heads more often than tails He says you can buy it from him for $1 You say that you want to test the coin before you buy it He says OK , but you can only flip it 5 times
Probability Theory Example How many heads would convince you that it was a special coin? 3?, 4?, 5? How sure do you want to be that it is a special coin? What is the chance that he is fooling you and selling a regular quarter?
2 Hypotheses The coin is not biased, it s a normal quarter that you can get at any bank The likelihood of getting a heads on a single flip is 1/2, or .5 The coin is a special The probability of getting a heads on a single flip is greater than .5
Hypothesis Testing Let s assume that it is a regular, old quarter p = .5 (the probability of getting a heads on a SINGLE toss is .5) We flip the coin and get 4 heads. What is the probability of this result, assuming the coin is fair? Note that this is a problem involving conditional probability : p(4/5 heads|coin is fair)
How do I solve this problem? Any Ideas? You might think that, using the rule of Joint events, that: p(4 /5)= p(H1) p(H2) p(H3) p(H4) p(4 /5)= p(H)4 p(4 /5)=.0625 NO!
Why not? You have just calculated the probability of getting exactly H, H, H, H on four flips of our coin. What is the probability of getting H, T, H, T on 4 flips? Exactly the same as H, H, H, H any single combination of 4 H and T are equally likely in this scenario. Here they are:
All Possibilities: 4 flips of a coin HHTT HTHT TTTH HTTH HHHT TTHT TTHH HHTH THTT THTH HTHH TTTT HTTT THHT THHH HHHH 0 Heads 1 heads 2 heads 3 heads 4 heads f = 1 4 6 4 1
Relative Frequency Dist Heads f p 0 1 .0625 1 4 .25 2 6 .375 3 4 .25 4 1 .0625 Total 16 1.00
YES! Relative frequency and Probability are related by Bernoulli s theorem If I did this test again, would I get the same result? (probably not) If I did it over and over again, what results would we expect given a non- biased coin? How many combinations?
What if I figured out the total number of possible outcomes of this experiment, and I figured out the total number of outcomes that had 4/5 heads? Prob of 4/5 = Freq of 4/5 Total N of outcomes How many outcomes?
Lots H, H, T, T, T T, H, T, H, T H, T, H, T, H ETC. ETC. ETC.
How many 4 out of 5? 5 flips (exactly) 4 heads 1 possibility H, H, H, H, T Another H, H, H, T, H More H, H, T, H, H And H, T, H, H, H Lastly T, H, H, H, H
5 Flips: All possibilities HHTTT HTTHT HTHTT THHTT THTHT TTHHT HTTTH THTTH TTHTH TTTHH TTHHH THHTH THTHH HTTHH HTHTH HHTTH THHHH THHHT HTHHH HTHHT HHTHH HHTHT HHHTH HHHTT HHHHT HTTTT THTTT TTHTT TTTHT TTTTH TTTTT HHHHH 0 heads 1 head 2 heads 3 heads 4 heads 5 heads p = .03125 .15625 .3125 .3125 .15625 .03125
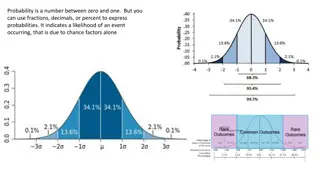
At least 4 heads out of 5 Given a Fair Coin: Getting at least 4 heads out of 5 flips is p(4) + p(5) B1 B5 C .15625+.03125 = .1875 B4 B2 B3 There is a 18.75% chance that, upon flipping a FAIR coin 5 times, you will get at least 4 heads.
You gonna buy that quarter? What if this guy let you flip this quarter 100 times? How many times do you want to flip it? (the more the better, yes? In the long run???)


 < 1 (in Venn diagrams)")
 = 1")
 = Σp(Bi)")