Probability Theory Insights
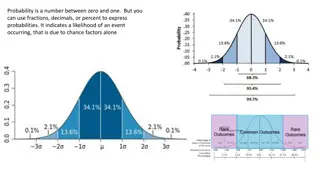
Explore the concept of probability through real-life scenarios, histograms, sample spaces, and Venn diagrams. Calculate probabilities of events like queuing times in a post office, roadwork delays for motorists, and completion times for students. Enhance your understanding with detailed examples and exercises from Chapter 5.

Download Presentation

Please find below an Image/Link to download the presentation.
The content on the website is provided AS IS for your information and personal use only. It may not be sold, licensed, or shared on other websites without obtaining consent from the author. If you encounter any issues during the download, it is possible that the publisher has removed the file from their server.
You are allowed to download the files provided on this website for personal or commercial use, subject to the condition that they are used lawfully. All files are the property of their respective owners.
The content on the website is provided AS IS for your information and personal use only. It may not be sold, licensed, or shared on other websites without obtaining consent from the author.
E N D
Presentation Transcript
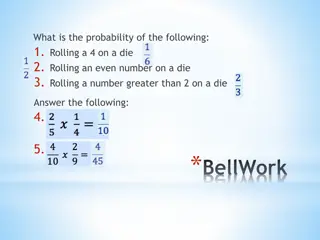
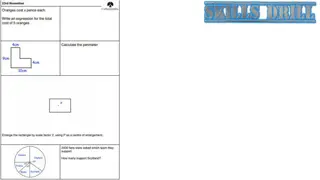
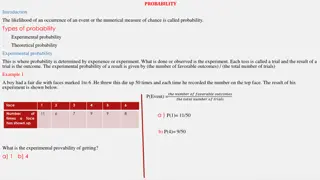
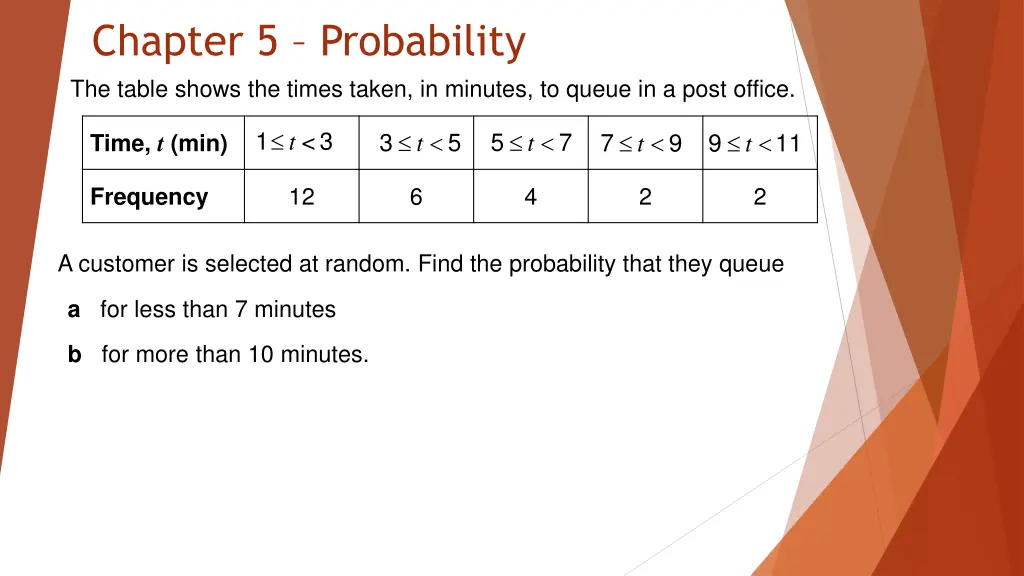
Chapter 5 Probability The table shows the times taken, in minutes, to queue in a post office. 1 <3 t 5 7 3 5 7 9 9 11 t Time, t (min) t t t 12 6 4 2 2 Frequency A customer is selected at random. Find the probability that they queue a for less than 7 minutes b for more than 10 minutes.
Starter The partially completed histogram and the partially completed table show the times, to the nearest minute, that a random sample of motorists were delayed by roadworks on a stretch of motorway. Delay (minutes) 2 < t 6 6 < t 8 8 < t 12 12 < t 15 15 < t 20 Estimate the probability that a randomly selected motorist was delayed by the roadworks for Number of motorists 36 24 5 a more than 8 minutes. b less than 15 minutes.
5.1 Calculating probabilities An experiment is a repeated process that rises to a number of outcomes. An event is a collection of one or more outcomes. A sample space is a set of all possibilities. Equally likely means all probabilities for all outcomes are the same. Probabilities always adds to 1
Example Two spinners are numbered 1-4. Both are spun and the sum of the numbers (x) is calculated. (a)Draw a sample space (b)Find P(x = 5) and P(x > 5)
Example 2 The table shows the time taken, in minutes, for a group of students to complete a number puzzle. Time, ? Frequency a) Estimate the probability that a student completed the puzzle in under 9 minutes 6 5 ? < 7 13 7 ? < 9 12 9 ? < 11 b) Estimate the probability that a student completed the puzzle in 10.5 minutes or more 5 11 ? < 13 4 13 ? 15
Exercise book Exercise 5A pages 71-72
5.2 Venn diagrams ? ? ? ? ? ? The event ?and? Known as the intersection of ? and ?. The event ?or? Known as the union of ? and ?. ? ? ? ? ? ? These can be combined, e.g. ? and not ? . The event not ? Known as the union of ? and ?.
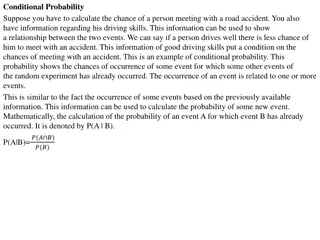
An important technique Given that ? ? = 0.6 and ? ? ?? ? = 0.85, find the probability of: a) ?(??? ? ??? ?) b) ? ???? ?? ? ??? ?
Example In a class of 30 students, 7 are in the choir, 5 are in the school band and 2 are in both the choir and the band. Draw a Venn diagram to show this information. S B C
Example 2 A vet surveys 100 of her clients. She finds that 25 own dogs, 15 own dogs and cats, 11 own dogs and tropical fish, 53 own cats, 10 own cats and tropical fish, 7 own dogs, cats and tropical fish, 40 own tropical fish. Fill in this Venn Diagram, and hence answer the following questions: a) ? ???? ??? ???? b) ? ???? ??? ??? ???????? ??? c) ?(???? ??? ??? ????, ????,?? ???????? ??? )
Exercise book Exercise 5B pages 74-75
5.3 Mutually exclusive and independent events Two events are said to be mutually exclusive if they can t occur at the same time. If A and B are mutually exclusive, then the follow rules apply. P(A and B) = 0 P(A or B) = P(A) + P(B) The Venn diagram will look like this A B
Independent events Two events are independent if one event doesn t effect the other. This means the probability of b stays the same regardless of A P(A and B) = P(A) x P(B) This rule is used to work out the intersection and to prove whether two events are independent or not. An example of independent events are flipping a coin and rolling a dice.
Example Events A and B are mutually exclusive and P(A) = 0.2 and P(B) = 0.4 Calculate: a) ( ) P A B b) ( ') P A B c) ( ' P A ') B
Example 2 Events C and D are independent and P(C) = 1/3 and P(D) = 1/5 Calculate: a) ( ) P C D b) ( ') P C D c) ( ' P C ') D
Example 3 The Venn Diagram shows the number of students in a particular class that watch any of three popular TV programmes, A, B and C. S B C A 3 5 7 10 4 a) Find the probability that a student watches B or C or both. 1 b) Determine whether watching A and watching B are statistically independent.
Exercise book Exercise 5C pages 77-78 The Venn diagram shows the probability of each event. Given that ? and ? are independent, determine the possible values of ?. ? 0.3 0.2 ? ? ?
5.4 Tree diagrams A bag contains 7 green beads and 5 blue beads. A bead is taken at random, the colour recorded, and the bead is not replaced. A second is then taken and the colour recorded. Find P(1 Green and 1 Blue).
Example without a diagram There are 3 yellow and 2 green counters in a bag. I take two counters at random. Determine the probability that: a) They are of the same colour. b) They are of different colours.
Exercise book Exercise 5D pages 79-80