Process Mapping for Healthcare Workflow Improvement
Learn about Gane-Sarson data flow diagrams, methods for diagramming processes, Gane-Sarson symbols and conventions, and entities representation in process mapping. Understand how to assess patient processes for transformation and naming conventions for processes.

Download Presentation

Please find below an Image/Link to download the presentation.
The content on the website is provided AS IS for your information and personal use only. It may not be sold, licensed, or shared on other websites without obtaining consent from the author.If you encounter any issues during the download, it is possible that the publisher has removed the file from their server.
You are allowed to download the files provided on this website for personal or commercial use, subject to the condition that they are used lawfully. All files are the property of their respective owners.
The content on the website is provided AS IS for your information and personal use only. It may not be sold, licensed, or shared on other websites without obtaining consent from the author.
E N D
Presentation Transcript
Health Care Workflow Process Improvement Process Mapping Lecture d This material (Comp 10 Unit 3) was developed by Duke University, funded by the Department of Health and Human Services, Office of the National Coordinator for Health Information Technology under Award Number IU24OC000024. This material was updated by Normandale Community College, funded under Award Number 90WT0003. This work is licensed under the Creative Commons Attribution-NonCommercial-ShareAlike 4.0 International License. To view a copy of this license, visit http://creativecommons.org/licenses/by-nc-sa/4.0/
Process Mapping Learning Objectives Read and interpret Gane-Sarson data flow diagram 2
Process Mapping Lecture d - Topics Gane-Sarson symbols and conventions for process mapping Reading Gane-Sarson data flow diagrams 3
Methods for Diagramming Processes Table 3.4 Methods for Diagramming Processes. Nahm, M, 2012. 4
Background Gane-Sarson notation was introduced in Chris Gane and Trish Sarson s 1977 book Structured Systems Analysis: Tools and Techniques Gane-Sarson notation is used for data flow diagrams 5
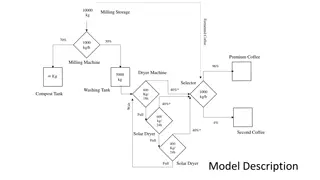
Use Gane-Sarson data flow diagrams show Movement Transformation Storage of data 6
Simplified On-line Appointment Scheduling Example 7
Gane-Sarson Symbols Double square Rounded rectangle Arrow Open-ended rectangle Symbols used for Gane-Sarson 8
Entities Entities Represent people, organizations, or other things that interact with the system Send or consume information If the same entity is shown more than once in a diagram, a diagonal line is added to the lower right-hand corner to visually distinguish it 9
Process 1 Assess patient Processes transform data Process should be named or described with: Single word (a verb) Phrase Simple sentence o Describing what the process does Similar to other notations, a good name will generally consist of a verb-object phrase such as check availability In some cases, the processes are named for a role, an organization, or a machine that performs the process 10
Flow prescription A data flow is a pipe through which data travel Straight lines indicate flow or movement of information Flow names indicate the meaning of the data that moves along the flow Flow can: Represent only one type of data, e.g., request or reply , OR Consolidate several elementary data flows into one flow, o Request and reply The same content may have a different meaning in different parts of the system Every line needs an arrow head to indicate direction of the data flow 11
EMR Data Store Collection of data at rest Can be in computerized or non- computerized format Stores are passive Processes put data in or read data D1 Claims database 12
Entities Instead of Event List Gane-Sarson notation does not use event lists Things that stimulate action from a system are indicated by entities 13
Diagram Levels Diagram levels are Roll-up and drill-down Functional decomposition is used to represent each process in more detailed steps / processes Context diagram is highest level As many lower-levels as needed 14
Conventions Meaningful names Number processes and data stores Make sure the DFD is internally consistent and consistent with any associated DFDs Exceptions are shown on lower-level diagrams 15
Conventions (continued) Size of the shapes should be consistent throughout the diagram This limits the length of the name Color shading for shapes and arrows may be used to visually show different Entities Processes Data stores Flows Arrows in Gane-Sarson are straight and horizontal or vertical 16
Rules for Correctness Entities may not Send data directly to other entities Send data directly to data stores Get data directly from data stores No spontaneous data creation No black holes 17
Maintenance Gane-Sarson is a set of symbols and conventions named for the people who developed it. There is no formal maintenance organization. Individuals use and adapt it to suit their needs. 18
Process Mapping Summary Lecture d Gane-Sarson symbols and conventions for process mapping Reading Gane-Sarson data flow diagrams 19
Process Mapping References Lecture d References Gane, C., & Sarson, T. (1979). Structured Systems Analysis: Tools and Techniques. Englewood Cliffs, NJ: Prentice Hall. Ken Hopkins, Curriculum Council Suggested Standards for Information Systems 2006: 238/7, Newman College, 2001. Retrieved from Newman College Website Information Systems Teachers, Consensus Meetings 2005. (eds.). 2006, January). INFORMATION SYSTEMS, Suggested Standards for Information Systems Tools (Year 12 E238/7R). Retrieved from Trinity College Website Charts, Tables, Figures 3.4 Table. Methods for diagramming processes. Nahm, M, Duke University, 2012. Images Slide 7: Simplified on-line appointment scheduling example using Gane-Sarson notation. Nahm M., Duke University, 2012. Slide 8: Gane-Sarson symbols. Nahm M., Duke University, 2012. Slide 9: Entities symbol in Gane-Sarson notation. Nahm M., Duke University, 2012. Slide 10: Process symbol in Gane-Sarson notation. Nahm M., Duke University, 2012. Slide 11: Flow symbol in Gane-Sarson notation. Nahm M., Duke University, 2012. Slide 12: Data Store symbols in Sane-Garson notation. Nahm M., Duke University, 2012. 20
Process Mapping Lecture d This material was developed by Duke University, funded by the Department of Health and Human Services, Office of the National Coordinator for Health Information Technology under Award Number IU24OC000024. This material was updated by Normandale Community College, funded under Award Number 90WT0003. 21


")