Process Optimization Through Statistical Process Control
Explore the principles of Statistical Process Control (SPC), including its definition, rationale, control chart development, and implementation. Understand how SPC helps in monitoring and improving processes by separating variation from special causes and natural causes. Learn about the importance of managing factors such as environment, materials, methods, measurement, and manpower in optimizing processes effectively. Discover the role of Total Quality Tools and inhibitors that can impact the successful implementation of SPC.
Download Presentation

Please find below an Image/Link to download the presentation.
The content on the website is provided AS IS for your information and personal use only. It may not be sold, licensed, or shared on other websites without obtaining consent from the author. If you encounter any issues during the download, it is possible that the publisher has removed the file from their server.
You are allowed to download the files provided on this website for personal or commercial use, subject to the condition that they are used lawfully. All files are the property of their respective owners.
The content on the website is provided AS IS for your information and personal use only. It may not be sold, licensed, or shared on other websites without obtaining consent from the author.
E N D
Presentation Transcript
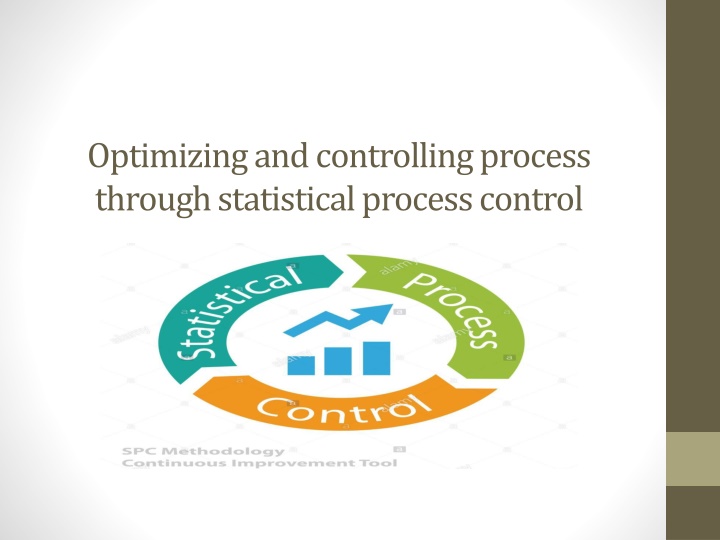
Optimizing and controlling process through statistical process control page 442
Chapter Outline Major topics: 1. Statistical Process Control Defined 2. Rationale for SPC 3. Control chart development 4. Management s role in SPC 5. Role of the total quality tools 6. Implementation and deployment of SPC 7. Inhibitors of SPC
STATISTICAL PROCESS CONTROL DEFINED All process are affected by multiple factors such as: 1. The environment the machines employed 2. The materials used 3. The methods(work instruction) provides 4. The measurement taken 5. The manpower(people) who operate the process These factors are called the 5 M s
STASTISTICAL PROCESS CONTROL DEFINED Statistical process control (SPC) is a statistical method of separating variation resulting from special causes from variation resulting from natural causes in order to eliminate the special causes and to establish and maintain consistency in the process, enabling process improvement.
Rationale for SPC 1. 2. 3. 4. 5. See page no. 444 Control of variation Continual improvement Predictability of processes Elimination of waste Product inspection
Control chart development Data category Chart type Statistical quality application Variables(measured values) x bar-R( See figure page 453 Mean value and range Charts dimensions and their precision, weight, time, strength, and other measurable quantities. example: anything physically measurable x tilde-R( Median and range Charts measurable quantities, similar to x bar-R, but requires fewer calculation to plot. Example as above
Control chart development(continue) Data category Chart type Statistical quality application Variables(measured values) x-Rs(also called x- chart See figure page 453 Individual measured values Used with long sample intervals; when subgrouping not possible. Example: products made in batches such as solution, coaching, etc. or grouping too expensive. Histogram must be normal
Control chart development(continue) Data category Chart type Statistical quality application Attributes(counted values) p-chart See figures page 454, 455 Percentage defective (also fraction defective) Charts the number of defects in samples of varying size as a percentage or fraction. Example: anywhere defects can be counted np-chart(also pn) Number of defective pieces Charts the number of defective pieces in sample of fixed size. Example: as above, but in fixed- size samples
Control chart development(continue) Data category Chart type Statistical quality application Attributes(counted values) c-chart See figure page 457 Number of defects Charts the number of defects in a product( single piece) of fixed size. Example: specific assemblies or products( e.g., pc boards, tires) u-chart Number of defects per unit area, time, length, etc. Charts the number of defects in a product of varying size (i.e., unlike products). Example: Carpet( area), extrusions length)
Managements role in SPC 1. 2. 3. See page 462 Commitment Training Involvement
Role of the total quality tools There are several tools: 1. Pareto charts 2. Cause and effect diagrams 3. Stratification 4. Check sheets 5. Histograms 6. Scatter diagrams 7. Run charts and control charts 8. Flow charts 9. Design of experiments 10. Five-s 11. Failure mode and effects analysis(FMEA)
Role of the total quality tools(continue) With SPC, the total quality tools have a dual role: First: they help eliminate special causes from the process so that the process can be brought under control. Second: their second role comes into play when, from time to time, the control chart reveals cause or when the operators wants to improve a process that is in control. See page 463
Implementation and deployment of SPC The implementation steps are divided into three phases: 1. Preparation 2. Planning 3. Execution See page 465 for detailed study
Implementation and deployment of SPC (continue) phase responsibility action preparation Top management Top management Step 1:Commit to SPC Step 2:Organize SPC committee Step 3:Train SPC committee Consultant or in-house expert planning SPC committee assisted by consultant or experts Step 4: Set SPC objectives Step 5:Identify target processes Step 6: train appropriate operators and support personnel Step 7: ensure repeatability of instruments and methods Step 8: delegate responsibility for operators to play key role Consultant or in-house expert QA Management
Implementation and deployment of SPC (continue) phase responsibility action execution SPC committee, operators, suppliers, customers Operator w/ expert assistance Consultant or in-house expert Operator Step 9: flowchart the process Step 10: eliminate the special causes of variation Step 11: develop control charts Step 12: collect and plot SPC data; monitor Step 13: determine process capability Step 14: Respond to trends and out-of-limits data Step 15: track SPC data Operator w/ expert assistance Operator SPC committee and management Operator w/ assistance as required Step 16: eliminate root causes of any new special causes of variation Step 17: continually improve the process (narrow the limits) All
Inhibitors of SPC 1. 2. 3. 4. 5. 6. 7. Capability in statistics Misdirected responsibility for SPC Failure to understand the target process Failure to have processes under control Inadequate training and discipline Measurement repeatability and reproducibility low production rates See page 471-473 Discussion Assignment 18-2 on page no. 479 The start of the Japanese Quality Movement
External Links Watch the Youtube link and go through the research to understand the topic better. https://www.youtube.com/watch?v=0GfBSuwhUwI https://www.sciencedirect.com/science/article/pii/S22128271 16001529

