Productivity vs. Performance in ArcGIS Server 10
In the context of ArcGIS Server 10, this presentation delves into the relationship between productivity and performance, exploring various aspects such as web map anatomy, watershed delineation in Python and C#, fundamental formulas for developers, server utilities, raster and vector services, and more. The visuals and content provide insights into server-side operations, data handling, service categorization, and application architecture simplification.

Download Presentation

Please find below an Image/Link to download the presentation.
The content on the website is provided AS IS for your information and personal use only. It may not be sold, licensed, or shared on other websites without obtaining consent from the author. If you encounter any issues during the download, it is possible that the publisher has removed the file from their server.
You are allowed to download the files provided on this website for personal or commercial use, subject to the condition that they are used lawfully. All files are the property of their respective owners.
The content on the website is provided AS IS for your information and personal use only. It may not be sold, licensed, or shared on other websites without obtaining consent from the author.
E N D
Presentation Transcript
Productivity vs. Performance in the Context of ArcGIS Server 10 Brendan Collins MGIS Capstone Project Presentation Advisor Prof. Frank Hardisty
Anatomy of the Web Map client-side Client Application (Web Browser) server-side Application Server Mapping Server (IIS / Apache) (ArcGIS Server)
Fundamental Formulas for Developers (triple constraint) $ 1??? = 24 ?? = 1440???? 1 ??????? ???????????
The Services Raster Services Vector Services Server Utilities Categorized by types of data handled in core business logic of service
Raster Services Watershed Delineation Input: Pour Point (x, y) Computes geographic area containing water which flows into supplied point Output: Watershed Polygon Zonal Statistics Input: User defined Polygon Outputs average precipitation for each month (12 operations in total)
Vector Services Server-side point clustering Input current extent and zoom level Returns aggregated point locations Data Extraction (Clip, Zip, Ship) Input user defined extent Outputs link for downloading extracted features
Server Utility Services KML HTTP Proxy Makes requests on behalf of client application Necessary for sites with cross-domain restrictions Database Connectivity Access database through ArcGIS Server MongoDB (non-relational document database) Opens possibility for additional feature geometry caching, and application architecture simplification
Measuring Outcomes Performance Latency Automated requests for repeatable testing Reliability Percent of successful responses Ease of Development Lines of Code Qualitative account of deployment Controlling for Bandwidth Throttling bandwidth using Charles HTTP Proxy
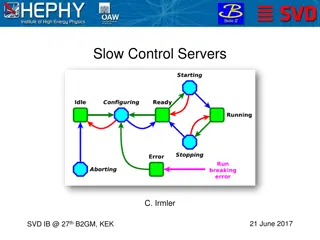
Multi-Mechanize Web performance and load testing framework Open-source written in Python Automates requests Logs Responses Outputs statistics including graphs
Conclusion The goal is not to suggest that one language is inferior to the other. The goal is understand when use of one tool over another is appropriate