Professor William Greene - Statistics and Data Analysis at Stern School of Business
"Explore the world of statistics and data analysis with Professor William Greene at Stern School of Business. Learn about course objectives, technical skills, and course prerequisites. Get expert help for multivariate regression analysis and more."
Download Presentation

Please find below an Image/Link to download the presentation.
The content on the website is provided AS IS for your information and personal use only. It may not be sold, licensed, or shared on other websites without obtaining consent from the author. If you encounter any issues during the download, it is possible that the publisher has removed the file from their server.
You are allowed to download the files provided on this website for personal or commercial use, subject to the condition that they are used lawfully. All files are the property of their respective owners.
The content on the website is provided AS IS for your information and personal use only. It may not be sold, licensed, or shared on other websites without obtaining consent from the author.
E N D
Presentation Transcript
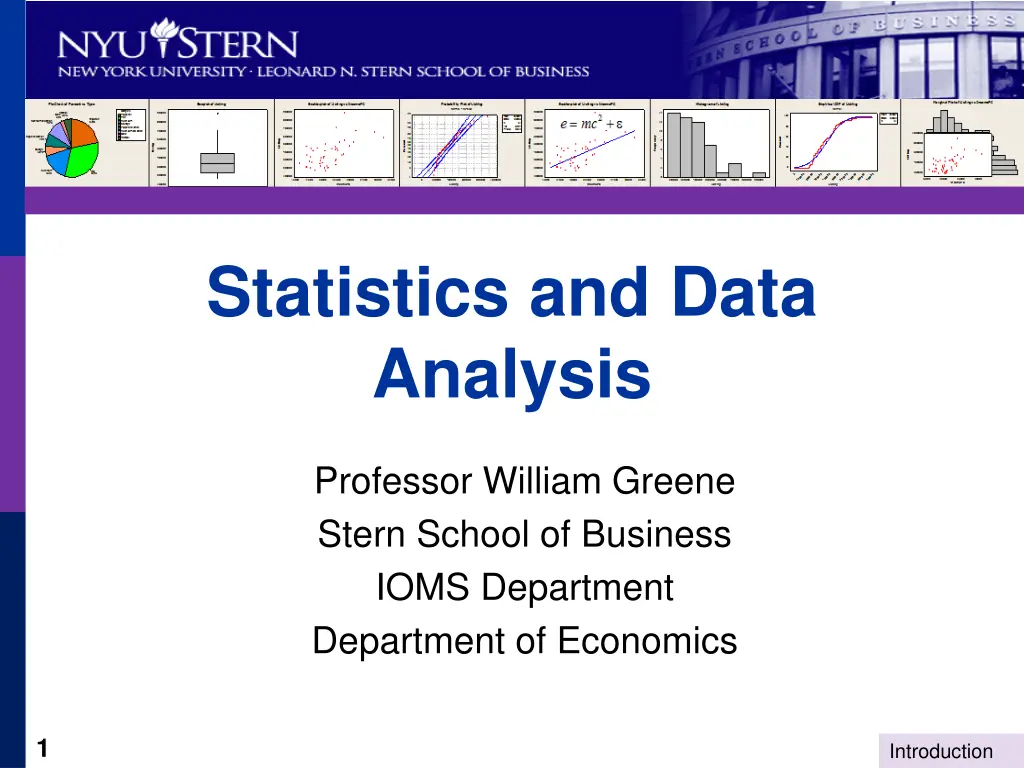
Statistics and Data Analysis Professor William Greene Stern School of Business IOMS Department Department of Economics 1 Introduction
Statistics and Data Analysis Introduction 2 Introduction
Professor William Greene; Economics and IOMS Departments Office: KMEC, 7-90 (Economics Department) Office phone: 212-998-0876 Office hours: TR 3-4PM (Other times, when the door is open. Or by appointment) Email: wgreene@stern.nyu.edu URL: http://people.stern.nyu.edu/wgreene http://people.stern.nyu.edu/wgreene/Statistics/Outline.htm 3 Introduction
Course Objectives Basic Understanding Random outcomes and random information Statistical information as the measured outcomes of random processes Technical Skills Analysis of statistical information Model building Presentation of statistical information 4 Introduction
Your Technical Help Is Wanted Our firm is looking for a [Ph.D.-level] statistician to assist us in analyzing a simple database of compensation levels. Our database includes 93 unique records for different institutions. We expect to analyze two dependent variables against 13 independent variables. We need to perform multivariate regression analysis to determine which of the variables are statistically significant. We also need to calculate the t-statistics for each of the independent variables and adjusted r-squared values for the multivariate regression model developed. We expect that some of the variables may need to be transformed prior to creating the regression analysis. Additional statistical approaches and techniques may be required as appropriate. Subsequent to the analysis of each of the variables, we will require a brief write-up detailing any relationships (or lack thereof) uncovered through the analysis. We anticipate that this write-up will be approximately 2-3 pages in length, excluding any supporting appendices. This write up should describe, in plain English, all relevant details regarding the analysis. 5 Introduction
Course Prerequisites Basic algebra. (Especially summation) Geometry (straight lines) Logs and exponents NOTE: I (you) will use only base e (natural) logs, not base 10 (common) logs in this course. A smattering of simple calculus. (I may use two or three derivatives during the semester.) 6 Introduction
Course Grade Midterm 30% 15% 30% 15% 10% Quizzes Final Problems Project You may work in groups of up to four students on homework sets and the project and submit one report for the group. Stern Policy mandates that no more than 35% of final grades in core courses may be A or A- 7 Introduction
Course Materials Notes: Distributed in first class Text: Stine and Foster. Statistics for Business: Decision Making and Analysis On the course website: Miscellaneous notes and materials Class slide presentations Problem sets with data when needed Software: Minitab 17 http://people.stern.nyu.edu/wgreene/Statistics/Outline.htm 8 Introduction
Course Software: Minitab The Current Version: Minitab 17 Rent or buy: www.onthehub.com $29.99 to rent for 6 months $99.99 to own. Search: www.onthehub.com/minitab 9 Introduction
Using SternApps The first time, go to http://apps.stern.nyu.edu Download the client software (CitrixReceiver.exe) Install (takes 2 minutes). After completion, Continue Select launch ica when it downloads When the license manager worries, select gonzo Now launch Minitab 17 from the apps menu (This procedure has gotten easier over time.) 10 Introduction
11 Introduction
Course Outline and Overview 1. Presenting Data Data Types Information content Data Description Graphical devices: Plots, histograms Statistical: Summary statistics 12 Introduction
Course Outline and Overview 2. Explaining How Random Data Arise Probability: Understanding unpredictable outcomes Precise mathematical principles of random outcomes e.g., gambling and games of chance Models = descriptions of random outcomes that don t have fixed mathematical laws The Normal distribution THE fundamental model for outcomes involving behavior Model building for random outcomes using the normal distribution 13 Introduction
Course Outline and Overview 3. Learning from Data Statistical inference Hypothesis testing: (Is the correlation large? Can we be confident that it not actually zero?) Hypothesis tests for specific applications Mean of a population: Is it a specific value? Applications in regression: Are the variables in the model really related? An application in marketing: Did the sales promotion work? How would you find out? Model building multiple regression analysis 14 Introduction

