Progress Report on Blue Swimming Crabs Fisheries Assessment
Blue swimming crabs (Portunus pelagicus) play a vital role in the fisheries of North Coast of Java. This report outlines the assessment conducted by the Research Center for Fisheries Management and Conservation in collaboration with the Indonesia Blue Swimming Crab Processors Association. The study focuses on mapping the fisheries, collecting bio-exploitation data, measuring seasonal abundance, and assessing the status of blue swimming crabs in the Java Sea.

Download Presentation

Please find below an Image/Link to download the presentation.
The content on the website is provided AS IS for your information and personal use only. It may not be sold, licensed, or shared on other websites without obtaining consent from the author.If you encounter any issues during the download, it is possible that the publisher has removed the file from their server.
You are allowed to download the files provided on this website for personal or commercial use, subject to the condition that they are used lawfully. All files are the property of their respective owners.
The content on the website is provided AS IS for your information and personal use only. It may not be sold, licensed, or shared on other websites without obtaining consent from the author.
E N D
Presentation Transcript
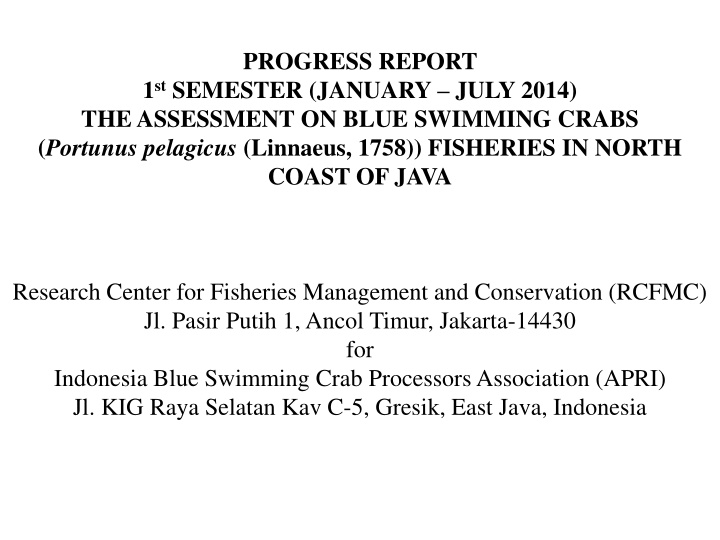
PROGRESS REPORT 1st SEMESTER (JANUARY JULY 2014) THE ASSESSMENT ON BLUE SWIMMING CRABS (Portunus pelagicus (Linnaeus, 1758)) FISHERIES IN NORTH COAST OF JAVA Research Center for Fisheries Management and Conservation (RCFMC) Jl. Pasir Putih 1, Ancol Timur, Jakarta-14430 for Indonesia Blue Swimming Crab Processors Association (APRI) Jl. KIG Raya Selatan Kav C-5, Gresik, East Java, Indonesia
BACKGROUND Crab fishery has contributed as one of the source livelihood of small-scale fishers in the North of Java since the 1970s and still exist seasonally until to date. An intensive fishing increased since the 1990s, this along with increasing international market demand (FAO, 2013). Blue swimming Crabs (Portunus pelagicus Linnaeus, 1758) An economic important marine species, it ranked under tuna and shrimps. Sumiono (1997) and Sumiono et al. (2011) informed that Blue swimming Crabs in Indonesia distributed along the coastal area of east Sumatera, north of Java, South of Sulawesi, South and East Kalimantan. Among them, Jakarta and Cirebon Bays, Brebes, Rembang and Madura strait were the main fishing areas in the north coast of Java The estimate export volume in 2012 is around 28,000 tons, which is commercially valued at around 330 million USD (Fauzi, 2013).
The annual production in 2008 estimated at around 34,000 tons (FAO 2011) and it contributed 20% of world production after China. Worldwide policy on sustaining fish for food (including blue swimming crabs) should consider safety, security and sustainability issues of its resources. Wall Mart, Costco Wholesale, Sam s Club Whole Foods Market and others (Crawford, 2013) adopted those mainstreams of world market system. By 2020, it is expected that world buyers on fish product will only accept products that have been eco-labeling certified issued by the Marine Stewardship Council (MSC). Since 2014, RCFMC and APRI carried out a Blue swimming crab fisheries assessment in the north coast of Java. Observation was carried out through enumerator and onboard data collection system.
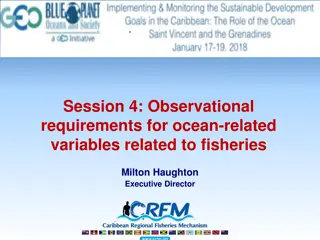
OBJECTIVES TO MAP THE FISHERIES AND ITS FISHING TACTIC AND STRATEGY TO COLLECT THE BIO-EXPLOITATION DATA TO MEASURE SEASONALLY IN-SITU ABUNDANCE TO DO AN ASSESSMENT ON STATUS OF BLUE SWIMMING CRABS IN JAVA SEA
METHODS DATA COLLECTING SYSTEM DESK STUDY SELECT AND TRAIN ENUMERATORS ENUMERATORS VALIDATION ON BOARD SURVEY EST. ABUNDANCE ECOLOGICAL RELATED SPECIES ENVIRONMENTAL CHARACTERISTICS
Fishery dependent: landings enumerator sampling Biological data Catch Effort Catch composition Population (L ,K,to, Z, M,F,E) Lm Lc Indices of stock abundance & recruitment Est.Biomass & SSB MSY Genetic population Mapping life cycle parameters Biological data Catch composition By-catch Catch-rate Larva Habitats Fishery independent (at sea research): Charterd Fishing Boats Harvest control rule Stock assesment Harvest Strategy FISHERY MANAGEMENT AREA
PRELIMINARY RESULTS ENUMERATORS
SIZE COMPOSITION Carapace width (mm) Location Male Female min max. mean min max mean Cirebon 85,7 146,8 110,0 14,7 72,2 143,3 110,7 18,3 Demak 68,7 168,4 115,3 18,8 59,2 161,9 116,8 18,6 Rembang 70,4 159,2 117,1 15,5 79,0 165,6 117,8 15,8 Sumenep 85,4 147,1 111,8 14,9 77,7 143,8 112,0 18,1 Sampit 87,0 165,0 135,0 14,7 90,0 183,0 130,0 13,8
SIZE BY TYPE OF GEAR Mean of carapace width (mm) Demak Female 102,1+15,6 103,9+15,8 102,6+14,7 107,1+13,2 116,9+16,0 110,7+15,6 122,1+17,1 124,3+16,8 117,7+15,0 118,8+15,6 Gears Rembang Male Male Female Mini bottom trawl Gillnet Collapsible trap
Lm and Lc Location Cirebon Demak Rembang Sumenep Sampit Lm (mm) Lc (mm) 116.19 115.55 116.58 111.68 129.50 98.12 112.47 101.51 100.06 126.78 Mean Std. Dev. 107.79 11.99 117.90 6.77 Note : Lm = Mean length (carapace width) at the first maturity Lc /L50 = Mean length (carapace width) at capturity
L/W (MALE AND FEMALE) 300 250 Cirebon Cirebon Cirebon Cirebon y = 2E-05x3.2597 R = 0.8878 n=123 250 200 y = 8E-06x3.4489 R = 0.8372 n=295 200 150 W (gr) W (gr) 150 100 100 50 50 0 0 0 50 100 150 200 0 20 40 60 80 100 120 140 160 CW (mm) CW (mm) Demak Demak 450 600 W(gram) y = 2E-05x3.2602 R = 0.9219 y = 9E-06x3.4512 R = 0.9544 400 W(gram) 250 200 0 50 0 50 100 150 200 0 50 100 150 200 -150 CW (mm) CW (mm) Rembang Rembang 400 400 W(gram) W (gram) W= 1E-05L3,385 R = 0,941 W= 3E-05L3,191 R = 0,927 200 200 0 0 0 50 100 150 200 0 50 100 150 200 CW (mm) CW (mm) Sampit Sampit 600 600 W(gram) W(gram) y = 6E-05x3,036 R = 0,878 400 400 y = 1E-05x3,404 R = 0,910 200 200 0 0 0 50 100 150 200 0 50 100 150 200 CW (mm) CW (mm)
SAMPLING STATIONS -6.4 S ON BOARD (JULY 2014) -6.45 S -6.5 S 14 TRAWL STATIONS 9 OCEANOGRAPHIC -6.55 S -6.6 S 5 3 4 -6.65 S 12 -6.7 S 1 13 6 2 7 8 9 14 -6.75 S CIREBON 10 11 -6.8 S Gebang -6.85 S -6.9 S 108.4 E 108.45 E 108.5 E 108.55 E 108.6 E 108.65 E 108.7 E 108.75 E 108.8 E 108.85 E 108.9 E
CATCH RATES -6.4 S -6.45 S -6.5 S -6.55 S -6.6 S -6.65 S -6.7 S -6.75 S CIREBON Tangkapan Ikan Demersal (kg) -6.8 S 0.475 to 1.34 1.34 to 1.992 1.992 to 4.13 4.13 to 5.511 Gebang -6.85 S -6.9 S 108.4 E 108.45 E 108.5 E 108.55 E 108.6 E 108.65 E 108.7 E 108.75 E 108.8 E 108.85 E 108.9 E TRAWL DREDGE
CATCH COMPOSITION (BOTTOM GILLNET)
LENGTH FREQUENCY BY LOCATIONS Carapace width (mm) Location Cirebon Demak Rembang 70,4 Sumenep 85,4 Sampit Male Female max 143,3 161,9 165,6 143,8 183,0 min 85,7 68,7 max. 146,8 168,4 159,2 147,1 165,0 mean 110,0 14,7 115,3 18,8 117,1 15,5 111,8 14,9 135,0 14,7 min 72,2 59,2 79,0 77,7 90,0 mean 110,7 18,3 116,8 18,6 117,8 15,8 112,0 18,1 130,0 13,8 87,0
ENVIRONMENTAL & HABITAT SALINITY ( ) TEMPERATURE (OC) pH DO (ppm) DEPTH (m) - 9 7 7 8 6 2 - - 9 - 8 - TRANSPARANCY (m) - 6 6 2 2 0 0.5 - - 2.5 STA SUBSTRAT SURFACE - 28.3 28.5 29 29.5 28.2 28 BOTTOM - 28.2 28.1 28.7 29 27.9 28 - - 28.6 SURFACE BOTTOM SURFACE BOTTOM SURFACE BOTTOM - - - 32 32 5.9 32 32 7 31 32.5 6.6 30 31 6 31 31 7 29 29 7 - - - - - - 30 30 7.3 1 2 3 4 5 6 7 8 9 10 11 12 13 - 6 - - - 6.3 6.9 6.4 6.3 6.8 7.3 - - 6.6 5.3 6.8 6.5 6.4 7.6 7.3 - - 7.3 Lumpur Lumpur Lumpur Lumpur Lumpur Lumpur - - Lumpur - Lumpur - 6.1 6.4 5.9 6.7 7 - - 7.4 29.2 3 - 28.3 - 28.2 - 31 - 32 - 5.5 - 6.6 - 8.6 - 8.7 - Note : Lumpur =muddy
ZOEA ABUNDANCE Est. Abundance (Ind/m3) Stadia St. 1 St. 2 St. 3 St. 4 St. 5 St. 6 St. 7 St. 10 St. 11 Zoea 1 1873 2548 573 2675 2956 Zoea 2 420 204 541 1376 Zoea 3 204 127 319 255 Zoea 4 51 0 64 51 Megalopa 0 0 0 0 15 15 15 10 0 19 42 31 11 0 96 3121 96 1847 32 1147 32 32 892 25 0 0 382 32


")

")