Project Jaguar Discussion on Market Update and Strategic Alternatives
In this confidential draft discussion material by Goldman Stanley, Project Jaguar's market update, valuation, potential strategic alternatives, and process recommendations are analyzed. The document highlights the undervaluation of Jaguar shares, proposes a premium acquisition process, and provides insights on management forecasts and product pipeline statuses.

Download Presentation

Please find below an Image/Link to download the presentation.
The content on the website is provided AS IS for your information and personal use only. It may not be sold, licensed, or shared on other websites without obtaining consent from the author.If you encounter any issues during the download, it is possible that the publisher has removed the file from their server.
You are allowed to download the files provided on this website for personal or commercial use, subject to the condition that they are used lawfully. All files are the property of their respective owners.
The content on the website is provided AS IS for your information and personal use only. It may not be sold, licensed, or shared on other websites without obtaining consent from the author.
E N D
Presentation Transcript
Confidential Draft Project Jaguar Discussion Materials August 31, 2021 Goldman Stanley 1
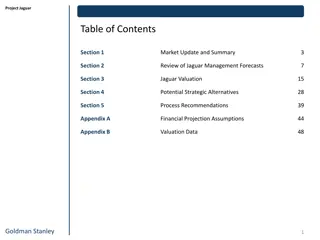
Project Jaguar Table of Contents Section 1 Market Update and Summary 3 Section 2 Review of Jaguar Management Forecasts 7 Section 3 Jaguar Valuation 15 Section 4 Potential Strategic Alternatives 28 Section 5 Process Recommendations 39 Appendix A Financial Projection Assumptions 44 Appendix B Valuation Data 48 Goldman Stanley 2
Section 1 Market Update and Summary Goldman Stanley 3
Project Jaguar MARKET UPDATE AND SUMMARY Executive Summary Jaguar Could Achieve a Positive Outcome for Shareholders with the Right Process Current Valuation Jaguar is Significantly Undervalued at Its Current Share Price Over the past year, Jaguar s share price has ranged between $131.51 and $186.42, recently falling by 25% after its Q2 earnings announcement The Comparable Public Companies, Precedent Transactions, and a Discounted Cash Flow (DCF) analysis based on management numbers point to a company undervalued by at least 30% Strategic Alternatives Equity / Debt Issuances and Add-On Acquisitions Are Not Ideal Jaguar s Debt / Total Capital is nearly 50% following the GW Pharma acquisition, and issuing Equity near the 52-week-low share price would create significant dilution Given Jaguar s Cash balance and the constraints above, smaller deals may be viable, but nothing that would substantially change the company s short-term valuation Proposed Process A 30 50% Premium ($170 $200) is Possible with the Right Process Jaguar s promising portfolio and market position could allow it to achieve a significantly higher valuation in an acquisition and acquire more resources for R&D and distribution We recommend a highly targeted process focused on the most likely ( Tier 1 ) potential partners, along with an outreach to Tier 2 potential partners Goldman Stanley 4
Project Jaguar MARKET UPDATE AND SUMMARY Biopharma Market Environment Last Twelve Months Performance Summary Statistics: Share Price Performance (Last Twelve Months; Rebased to 100%) Goldman Stanley 5
Project Jaguar MARKET UPDATE AND SUMMARY Jaguar Annotated Stock Price Performance Last Twelve Months Performance Jaguar Market Statistics: Share Price Performance and Volume Traded Goldman Stanley 6
Section 2 Review of Jaguar Management Forecasts Goldman Stanley 7
Project Jaguar REVIEW OF JAGUAR MANAGEMENT FORECASTS Overview of Jaguar s Product Pipeline Approval Statuses Based on Latest Investor Presentation(1) Included in Valuation Product Pre-Clinical Phase 1 Phase 2 Phase 3 Approved JZP-458 (Rylaze) FDA Approval on June 30, 2021 Zepzelca (1L SCLC) Phase 3 Trial Planned Vyxeos (AML or HR-MDS) Cooperative Group Study Planned Epidiolex (EMAS) Phase 3 Trial Planned JZP-385 (Tremor) Phase 3 Trial Planned JZP-150 (PTSD) Phase 3 Trial Planned JZP-324 (Oxybate) JZP-341 (Hematological) Oncology Cannabinoids Neuroscience Goldman Stanley 8 (1) Source: Management.
Project Jaguar REVIEW OF JAGUAR MANAGEMENT FORECASTS Preliminary Management Assumptions Summary of Key Product Assumptions in Management Case(1) ($ as Stated Except Peak Sales Estimates in $ Billions or $ Millions) Product: Xyrem Xywav Epidiolex Rylaze Sunosi Zepzelca JZP-385 JZP-150 Patient Population: 165K 175K 165K 175K ~6K new cases / year 165K 175K 25K 30K new / year 95K 100K ~7 million ~2 million Peak Penetration Rate: 6.3% (FY 21) 6.5% (FY 25) 55% (FY 27) 10% (FY 24) 25% (FY 25) 40% (FY 25) 8% (FY 27) 35% (FY 28) Generics Entrance: FY 25 FY 28 N/A N/A N/A N/A N/A N/A Average Price per Patient: $130K $160K $110K $125K $35K $55K $55K $67K $400K+ $8K $12K $1K $2K $1K $2K Pre-Generic Price Increases: ~6% ~2% ~5% ~1% ~9% ~2% ~3% ~3% Peak Sales (Projected): $245 million $509 million $687 million $796 million $993 million $1.4 billion $1.3 billion $2.5 billion Goldman Stanley 9 (1) Per management estimates from 8/3 meeting.
Project Jaguar REVIEW OF JAGUAR MANAGEMENT FORECASTS Summary of Operational Forecasts Per Jaguar Management; See Appendix A for Additional Details Comparison of Product Peak Sales and Operational KPIs Management Forecast(1) Consensus Forecast(2) Downside Case(3) $1.3 billion in FY 25 $1.0 billion in FY 25 $0.7 billion in FY 25 Xywav Peak Sales $2.5 billion in FY 27 $1.8 billion in FY 27 $1.3 billion in FY 27 Epidiolex Peak Sales $0.7 billion in FY 25 $0.5 billion in FY 25 $0.3 billion in FY 25 Zepzelca Peak Sales Risk-Adjusted Pipeline Peak Sales $0.5 billion in FY 30 $0.3 billion in FY 30 $0.2 billion in FY 30 FY 30 Revenue (CAGR) $4.6 billion (7%) $3.8 billion (5%) $3.1 billion (3%) 44% falling to 39% 44% falling to 39% 44% falling to 39% EBITDA Margins (1) Per management estimates from 8/3 meeting. (2) Based on Capital IQ median forecasts as of 8/31/2022. (3) Based on low end of market size and share estimates from press releases. Goldman Stanley 10
Project Jaguar REVIEW OF JAGUAR MANAGEMENT FORECASTS Revenue Projections Comparison of 10-Year Revenue Forecasts Peak Sales by Product: Includes Risk-Adjusted Revenue from Pipeline Drugs (JZP-385 and JZP-150) Goldman Stanley 11
Project Jaguar REVIEW OF JAGUAR MANAGEMENT FORECASTS EBITDA Projections Comparison of 10-Year EBITDA Forecasts Key Assumptions: Includes Risk-Adjusted EBITDA from Pipeline Drugs (JZP-385 and JZP-150) Goldman Stanley 12
Project Jaguar REVIEW OF JAGUAR MANAGEMENT FORECASTS Historical and Projected Net Sales by Product Management Case Forecasts(1) ($ USD in Billions; Pipeline Drug Sales Have Been Probability-Adjusted) $7 B $6 B $5 B JZP-150 JZP-385 Other Drugs $4 B Zepzelca Sunosi Rylaze $3 B Epidiolex/Epidyolex Xywav Xyrem $2 B $1 B $0 B FY21 FY22 FY23 FY24 FY25 FY26 FY27 FY28 FY29 FY30 Goldman Stanley 13 (1) Per management estimates from 8/3 meeting.
Project Jaguar REVIEW OF JAGUAR MANAGEMENT FORECASTS Jaguar Forecast Summary Net Sales by Product (Risk-Adjusted Pipeline Sales) Peak Sales Assumptions: Management Forecast(1) Consensus Forecast(2) ($ in Billions) $7 B $7 B $5.5 B $5.5 B$5.8 B$6.2 B Product Mgmt Base $6 B $6 B $5.1 B$4.8 B$4.6 B $4.5 B$4.6 B$4.8 B $4.8 B $5 B $5 B $4.4 B$3.9 B $4.1 B Xywav $1.3 $1.0 $4.1 B$3.9 B$3.8 B $3.9 B $4 B $4 B $3.3 B $3.3 B $3 B $3 B Epidiolex $2.5 $1.8 $2 B $2 B $1 B $1 B Zepzelca $0.7 $0.5 $0 B $0 B FY21 FY22 FY23 FY24 FY25 FY26 FY27 FY28 FY29 FY30 FY21 FY22 FY23 FY24 FY25 FY26 FY27 FY28 FY29 FY30 Product Mgmt Down Downside Case(3) Xywav $1.3 $0.7 Epidiolex $2.5 $1.3 Zepzelca $0.7 $0.3 Pipeline & Other Epidiolex Xywav Xyrem (1) Per management estimates from 8/3 meeting. (2) Based on Capital IQ median forecasts as of 8/31/2022. (3) Based on low end of market size and share estimates from press releases. Goldman Stanley 14
Section 3 Jaguar Valuation Goldman Stanley 15
Project Jaguar JAGUAR VALUATION Overview of Selected Valuation Methodologies Description of Considered and Applied Methodologies Category Methodology Description Used in Valuation A Values Jaguar based on comparable, publicly traded specialty biopharma companies Applies comparable companies forward multiples of Revenue, EBITDA, and Net Income to company forecasts Comparable Public Companies Trading Valuation B Values Jaguar based on multiples paid for previously acquired biopharma companies Applies historical multiples of Revenue and EBITDA to company forecasts Precedent Transactions M&A Valuation C Transaction Premiums Applies 1-day, 1-week, and 1-month premiums paid for biopharma targets to Jaguar s applicable share price D DCF analysis of each product s expected future cash flows, with product-specific COGS and SG&A expenses Risk-adjusts pipeline sales and attributes minimal Terminal Value to branded products due to risk from generics Sum-of-the-Parts DCF Analysis Intrinsic Valuation E Values the company as a whole on a going-concern basis Cash flows are based on revenue from current and pipeline products, with expenses linked to total revenue Risk-adjusts pipeline sales and attributes substantial Terminal Value to Jaguar Going Concern DCF Analysis F Historical Trading History Analyzes movements in Jaguar s historical stock price and evaluates its trading history Reference Valuation G Research Analyst Price Targets Reviews recent stock price targets from equity research analysts, generally based on forward multiples Goldman Stanley 16
Project Jaguar JAGUAR VALUATION Preliminary Valuation Summary Based on Management, Consensus, and Downside Forecasts(1)(2) Indicative Share Price (25th to 75th Percentile) Approach Metric Range $137.35 $245.07 CY 23 TEV / Revenue 3.5x 5.1x Trading Valuation Public Comps (Consensus Forecasts Assumed) Current Share Price: $226.44 $454.39 CY 23 TEV / EBITDA 11.1x 19.1x A $131.71 $171.46 $272.25 13.8x 22.3x CY 23 P / E LTM TEV / Revenue 5.7x 10.2x $133.36 $309.45 Precedent Transactions B LTM TEV / EBITDA 11.8x 29.8x $96.39 $389.05 M&A Valuation 1-Day Premiums 37.3% 54.1% $180.86 $202.97 Transaction Premiums 39.9% 60.5% 1-Week Premiums $199.92 $229.34 C 35.5% 69.1% 1-Month Premiums $209.31 $261.25 Mgmt. Forecast $223.93 $250.19 Intrinsic Valuation Going Concern DCF Analysis 6.5% 7.5% Initial WACC Consensus Forecast $159.38 $178.61 E Downside Case $108.47 $123.59 $0.00 $50.00 $100.00 $150.00 $200.00 $250.00 $300.00 $350.00 $400.00 $450.00 $500.00 (1) Market data based on closing prices as of 8/31/2021. (2) Management based on 8/3 meeting data; Consensus based on Capital IQ forecasts as of 8/31/2022; Downside based on low end of market share/size estimates. Goldman Stanley 17
Project Jaguar JAGUAR VALUATION Peer Benchmarking Analysis U.S.-Based Specialty Pharma Companies with LTM Revenue Between $1 and $5 Billion Jaguar s unique financial profile (similar growth to its peer specialty pharmaceutical companies, but with greater scale) should drive a premium valuation. ($ USD in Billions) Even in the Downside Case, with significantly lower projected Revenue and EBITDA, Jaguar still exceeds the scale all but two peer companies by CY 23. Additionally, Jaguar s Revenue is more closely linked to existing products and, therefore, may be even higher on a probability-adjusted basis. Goldman Stanley 18
Project Jaguar JAGUAR VALUATION Peer Companies Multiples and Growth Rates U.S.-Based Specialty Pharma Companies with LTM Revenue Between $1 and $5 Billion Goldman Stanley 19
Project Jaguar JAGUAR VALUATION Analysis of Precedent Transactions LTM EBITDA Multiples Based on Biopharma M&A Targets with Over $500 Million in LTM Revenue Since 8/31/2011(1) Goldman Stanley 20
Project Jaguar JAGUAR VALUATION Premiums Paid Analysis Review of Premiums Paid for U.S.-Based Biopharma Sellers Since 8/31/2011(1) Goldman Stanley reviewed a list of 100 transactions involving U.S.-based biotechnology and pharmaceutical sellers over the past 10 years and narrowed the list to companies with over $500 million in LTM revenue. Early-stage acquisitions were excluded from the set because their cash flow profiles, risk, and valuation multiples are not comparable to Jaguar s existing, profitable business model in proven markets. Goldman Stanley 21
Project Jaguar JAGUAR VALUATION Discounted Cash Flow Analysis Jaguar Unlevered Free Cash Flow Projections Based on Consensus Forecast Figures(1) Discounted Cash Flow Analysis uses the following assumptions: ($ USD in Millions Except for Per Share Data) Goldman Stanley 22
Project Jaguar JAGUAR VALUATION Jaguar DCF Sensitivity Analysis Variance to Implied Share Price in DCF Based on Consensus Forecasts(1) Goldman Stanley 23
Project Jaguar JAGUAR VALUATION Jaguar WACC Analysis Based on Jaguar s Historical Beta and Capital Structure and Comparable Companies(1) Goldman Stanley reviewed Jaguar s historical data and information from the comparable companies: Given the wide differences in capital structures, it is crucial to calculate WACC via multiple methods The DCF assumes an initial WACC of 7.0% declining to 5.4% by Year 10, based on WACC figures in the 6.5% 8.5% range for Jaguar s higher-growth peers The final 5.4% rate in the Terminal Period is close to the average WACC produced by the three methods described here ($ USD in Billions) WACC Calculation Assumption Notes Low Base High Equity Risk Premium Duff & Phelps Valuation Handbook (2021) 5.5% 5.5% 5.5% Risk-Free Rate 10-year U.S. Treasury Yield as of 8/31/2020 1.3% 1.3% 1.3% Jaguar historical Beta and re-levered Beta from the comparable companies Levered Beta 0.78 0.97 1.35 Cost of Equity (Ke) Based on Capital Asset Pricing Model (CAPM) 5.6% 6.6% 8.7% Current capital structure and optimal capital structure from comps median Equity / Total Capitalization 96.6% 52.2% 52.2% Weighted YTM of Jaguar s current Debt, including Convertible Bonds Pre-Tax Cost of Debt 3.1% 3.1% 3.1% U.S. corporate tax rate + international benefits Tax Rate (T) 15.0% 15.0% 15.0% After-Tax Cost of Debt (Kd) 2.6% 2.6% 2.6% Current balance or comparables median Debt percentage Total Debt (D) $0.5 B $7.6 B $7.6 B Total Capitalization Jaguar current Debt + Equity Value $15.9 B $15.9 B $15.9 B Current capital structure and optimal capital structure from comps median Debt / Total Capitalization 3.4% 47.8% 47.8% WACC Ke * E / (D + E) + Kd * (1 T) * D / (D + E) 4.7% 5.5% 5.8% Goldman Stanley 24 (1) Market data based on closing prices as of 8/31/2021.
Project Jaguar JAGUAR VALUATION Overview of the Company s Top 20 Shareholders Ownership is Diverse and Primarily Large-Cap Institutional Asset Managers Goldman Stanley 25
Project Jaguar JAGUAR VALUATION Valuation Conclusions A 30 50% Premium ($170 $200) is Possible with the Right Process Jaguar Could Maximize Shareholder Value via a Broad Process Including Tier 1 and Tier 2 Partners Goldman Stanley 26
Section 4 Potential Strategic Alternatives Goldman Stanley 27
Project Jaguar POTENTIAL STRATEGIC ALTERNATIVES Potential Alternatives for Jaguar Both Standalone and Strategic Options Should Be Considered Multiple potential paths forward exist for Jaguar Many paths are not mutually exclusive (i.e., the company could pursue several at the same time) Given current market conditions and the company s capital structure, M&A options are more likely to maximize shareholder value Goldman Stanley 28
Project Jaguar POTENTIAL STRATEGIC ALTERNATIVES Assessment of Standalone / Strategic Alternatives Key Considerations Should Be Process Speed, Valuation, and Market Conditions Goldman Stanley 29
Project Jaguar POTENTIAL STRATEGIC ALTERNATIVES Criteria for Potential Strategic Partners Goldman Stanley Considered a Broad Range of Potential Biopharma Partners Size, Ability to Pay, Product Pipeline, and Strategic Fit Should All Be Considered At $200 / share, Jaguar would be worth an Enterprise Value of over $18 billion; potential partners should be able to use $18 billion in combined Cash and Debt to fund a potential deal Key Criteria Both branded and generics companies should be considered, given recent M&A activity Tier 1 Potential Partners Tier 2 Potential Partners Significantly larger than Jaguar Closer to Jaguar s size Market Cap Capable of paying at least $18- 20 billion in Cash and Debt May have to issue Stock to fund the full purchase price Ability to Pay Solid product and pipeline fit Solid product and pipeline fit Strategic Fit Goldman Stanley 30
Project Jaguar POTENTIAL STRATEGIC ALTERNATIVES Tier 1 and Tier 2 Potential Strategic Partners Summary of Partners by Viability and Geography Goldman Stanley 31
Project Jaguar POTENTIAL STRATEGIC ALTERNATIVES Overview of Tier 1 Potential Partners Goldman Stanley Conducted an Initial Evaluation of Each Partner ($ USD in Billions) Goldman Stanley 32
Project Jaguar POTENTIAL STRATEGIC ALTERNATIVES Company Profile: Amgen ($ USD in Billions) Business Description Management Team Amgen Inc. discovers, develops, manufactures, and delivers human therapeutics worldwide. It focuses on inflammation, oncology/hematology, bone health, cardiovascular disease, nephrology, and neuroscience areas. Robert Bradway Peter Griffith Esteban Santos Linda Louie Mike Zahigian Jonathan Graham Nancy Grygiel Chairmen & CEO EVP & CFO EVP, Operations VP, Finance & CAO SVP & CIO EVP & GC SVP & CCO Amgen Inc. serves healthcare providers, including physicians or their clinics, dialysis centers, hospitals, and pharmacies. It distributes its products through pharmaceutical wholesale distributors, as well as direct-to-consumer channels. Amgen Headquarters: Employees: Founded: California 24,200 1980 Financial Information(1) Business Segments and Product Lines Notable Acquisitions Market Cap: Enterprise Value: LTM Revenue: LTM EBITDA: TEV / Revenue: TEV / EBITDA: $128.1 $152.8 $25.5 $12.6 6.0x 12.2x Enbrel To treat plaque psoriasis, rheumatoid arthritis, and psoriatic arthritis. Neulasta Reduces the chance of infection due a low white blood cell count in patients with cancer. Prolia To treat postmenopausal women with osteoporosis. Xgeva To prevent skeletal-related events. Otezla To treat adult patients with plaque psoriasis, psoriatic arthritis, and oral ulcers associated with Beh et s disease. Aranesp To treat a lower-than-normal number of red blood cells and anemia. KYPROLIS To treat patients with relapsed or refractory multiple myeloma. Repatha To reduce the risks of myocardial infarction, stroke, and coronary revascularization. Other Products Nplate, Vectibix, MVASI, Parsabiv, EPOGEN, KANJINTI, BLINCYTO, Aimovig, EVENITY, AMGEVITATM, Sensipar/Mimpara, NEUPOGEN, IMLYGIC, Corlanor, and AVSOLA. Otezla Worldwide Rights $13.4 billion Aug 2019 One-Year Price History(1) Onyx Pharmaceuticals $10.0 billion Aug 2013 Goldman Stanley 33 (1) Financial data as of August 31, 2021.
Project Jaguar POTENTIAL STRATEGIC ALTERNATIVES Company Profile: Bristol-Myers Squibb ($ USD in Billions) Business Description Management Team Bristol-Myers Squibb Company discovers, develops, licenses, manufactures, and markets biopharmaceutical products worldwide, including chemically- synthesized drugs, small molecules, and biologics. It offers products for hematology, oncology, cardiovascular, immunology, fibrotic, neuroscience, and COVID-19. Giovanni Caforio, MD David Elkins Greg Meyers Paul von Autenried Christopher Boerner CEO EVP & CFO EVP & CTO EVP & CIO EVP & CCO Bristol-Myers Squibb Headquarters: Employees: Founded: New York 32,200 1887 It sells products to wholesalers, distributors, pharmacies, retailers, hospitals, clinics, and government agencies. The company was formerly known as Bristol- Myers Company. Financial Information(1) Business Segments and Product Lines Notable Acquisitions Market Cap: Enterprise Value: LTM Revenue: LTM EBITDA: TEV / Revenue: TEV / EBITDA: $148.6 $46.3 $44.4 $19.0 4.1x 9.5x Revlimid An oral immunomodulatory drug for the treatment of multiple myeloma. Eliquis An oral inhibitor for reduction in risk of stroke/systemic embolism in NVAF, and for the treatment of DVT/PE. Opdivo Anti-cancer indications. Pomalyst/Imnovid For patients with multiple myeloma. Orencia For adult patients with active RA and psoriatic arthritis. Sprycel For the treatment of Philadelphia chromosome-positive chronic myeloid leukemia. Yervoy For patients with unresectable or metastatic melanoma. Abraxane Protein-bound chemotherapy product. Reblozyl For anemia in adult patients with beta thalassemia. Empliciti For the treatment of multiple myeloma. Other Products Zeposia, Breyanzi, Inrebic, and Onureg. MyoKardia $13.1 billion Oct 2020 One-Year Price History(1) Celgene $99.6 billion Jan 2019 Goldman Stanley 34 (1) Financial data as of August 31, 2021.
Project Jaguar POTENTIAL STRATEGIC ALTERNATIVES Company Profile: Gilead Sciences ($ USD in Billions) Business Description Management Team Gilead Sciences, Inc., a biopharmaceutical company, discovers, develops, and commercializes medicines in the areas of unmet medical need in the United States, Europe, and internationally. It offers treatments for HIV/AIDS, liver diseases, certain cancers, and cardiovascular diseases, and it offers products for hematology, oncology, and cell therapy patients. Daniel O Day Andrew Dickinson Stacey Ma Flavius Martin Johanna Mercier Merdad Parsey, MD, PhD Deborah Telman Chairman & CEO EVP & CFO EVP, Development EVP, Research Gilead Sciences CCO CMO Headquarters: Employees: Founded: California 14,400 1987 The company markets its products through its commercial teams and/or in conjunction with third-party distributors and corporate partners. EVP & GC Financial Information(1) Business Segments and Product Lines Notable Acquisitions Market Cap: Enterprise Value: LTM Revenue: LTM EBITDA: TEV / Revenue: TEV / EBITDA: $91.3 $114.6 $26.6 $14.3 4.3x 8.0x HIV/AIDS Biktarvy, Genvoya, Descovy, Odefsey, Truvada, Complera/ Eviplera, Stribild, and Atripla. COVID-19 Veklury (an injection for intravenous use). Liver Diseases Epclusa, Harvoni, Vosevi, Vemlidy, and Viread. Hematology, Oncology, and Cell Therapy Patients Epclusa, Harvoni, Vosevi, Vemlidy, and Viread. Pulmonary Arterial Hypertension Letairis (oral formulation for treatment). Chronic Angina Ranexa (oral formulation for treatment). Invasive Fungal Infections AmBisome (liposomal formation for treatment). Immunomedics $20.9 billion Sep 2020 One-Year Price History(1) Kite Pharma $11.3 billion Aug 2017 Goldman Stanley 35 (1) Financial data as of August 31, 2021.
Project Jaguar POTENTIAL STRATEGIC ALTERNATIVES Company Profile: Merck & Co. ($ USD in Billions) Business Description Management Team Merck & Co., Inc. operates as a healthcare company worldwide. It operates through two segments, Pharmaceutical and Animal Health, and offers products in areas such as oncology, immunology, neuroscience, virology, cardiovascular, pharmaceuticals, and vaccines. Robert Davis Caroline Litchfield Sanat Chattopadhyay Richard DeLuca Dean Li, MD, PhD Cristal Downing Chirfi Guindo President & CEO CFO EVP, Manufact. EVP, Animal Health EVP, Research EVP & CCO Merck & Co. It serves drug wholesalers and retailers, hospitals, government agencies, managed health care providers (including health maintenance organizations), pharmacy benefit managers, physicians and physician distributors, veterinarians, and animal producers. Headquarters: Employees: Founded: New Jersey 67,500 CMO 1891 Financial Information(1) Business Segments and Product Lines Notable Acquisitions Market Cap: Enterprise Value: LTM Revenue: LTM EBITDA: TEV / Revenue: TEV / EBITDA: $193.1 $211.1 $43.9 $15.4 4.8x 13.7x Keytruda Anti-PD-1 monotherapy for the treatment of cervical cancer, classic Hodgkin Lymphoma, and related melanomas and carcinomas, including non-small-cell lung cancer (NSCLC). Gardasil/Gardasil 9 Vaccines to help prevent certain diseases caused by certain types of human papillomavirus. Januvia/Janumet For the treatment of Type 2 diabetes. ProQuad/M-M-R II/Variva Pediatric combination of the measles, mumps, rubella, and varicella vaccines (and related viruses). Bridion Injection for the reversal of two types of neuromuscular blocking agents used during surgery. Livestock (Animal Health) Various antibiotics and anti-inflammatory drugs for use in cattle and swine. Companion Animals (Animal Health) Various oral and topical parasitic control products for dogs and cats. VelosBio $2.6 billion Nov 2020 One-Year Price History(1) Cubist Pharmaceuticals $10.2 billion Dec 2014 Goldman Stanley 36 (1) Financial data as of August 31, 2021.
Project Jaguar POTENTIAL STRATEGIC ALTERNATIVES Company Profile: Pfizer ($ USD in Billions) Business Description Management Team Pfizer Inc. discovers, develops, manufactures, markets, distributes, and sells biopharmaceutical products worldwide. It offers medicines and vaccines in therapeutic areas, including cardiovascular metabolic and women s health, small molecules, injectable and anti-infective medicines, and chronic immune and inflammatory diseases. Dr. Albert Bourla David Denton Mikael Dolsten Lidia Fonseca Angela Hwang Rady Johnson Douglas Lankler Chairman & CEO EVP & CFO President, R&D EVP & CTO President, Biopharma EVP & CCO Pfizer Headquarters: Employees: Founded: New York 79,000 1849 The company serves wholesalers, retailers, hospitals, clinics, government agencies, pharmacies, and individual provider offices, as well as disease control and prevention centers. EVP & GC Financial Information(1) Business Segments and Product Lines Notable Acquisitions Market Cap: Enterprise Value: LTM Revenue: LTM EBITDA: TEV / Revenue: TEV / EBITDA: $258.3 $276.1 $55.1 $19.6 5.0x 14.1x Biopharmaceuticals Comirnaty (COVID-19), Prevnar (pneumococcal disease), and Nimenrix (meningococcal ACWY disease). Oncology Ibrance (metastatic breast cancer), Xtandi (mCRPC, nmCRPC, and mCSPC), Inlyta (advanced RCC), and Sutent (advanced or metastatic RCC). Internal Medicine Eliquis (atrial fibrillation, thrombosis, and pulmonary embolism) and Premarin (menopause). Hospital Sulperazon (bacterial infections), Medrol (anti-inflammatory), and Zavicefta (bacterial infections). Inflammation & Immunology Xeljanz (RA, PsA, UC, and active polyarticular course juvenile idiopathic arthritis) and Enbrel (RA, juvenile idiopathic arthritis, PsA, and plaque psoriasis). Rare Disease Vyndaqel/Vyndamax (ATTR-cardiomyopathy and polyneuropathy), BeneFIX (hemophilia B), and Genotropin (human growth hormone replacement). Array BioPharma $11.5 billion Jun 2019 One-Year Price History(1) Medivation $14.3 billion Aug 2016 Goldman Stanley 37 (1) Financial data as of August 31, 2021.
Project Jaguar POTENTIAL STRATEGIC ALTERNATIVES Company Profile: Roche ($ USD in Billions) Business Description Management Team Roche Holding AG engages in the pharmaceuticals and diagnostics businesses in Europe and internationally. The company offers pharmaceutical products for treating oncology, neuroscience, infectious, immunology, cardiovascular and metabolism, ophthalmology, and respiratory, as well as anemia, cancer, dermatology, hemophilia, inflammatory and autoimmune, neurological, and transplantation. Dr. Severin Schwain Dr. Alan Hippe Bill Anderson Dr. Thomas Schinecker Dr. James Sabry Prof. Dr. Hans Clevers Claudia Bockstiegel Chairman & CEO CFO & CIO CEO, Pharmaceuticals CEO, Diagn. Head of Partnerships Roche R&D Head Headquarters: Employees: Founded: Switzerland 100,920 GC It also offers in-vitro tests for various diseases, such as cancer, diabetes, COVID- 19, hepatitis, and human papillomavirus. 1896 Financial Information(1) Business Segments and Product Lines Notable Acquisitions Market Cap: Enterprise Value: LTM Revenue: LTM EBITDA: TEV / Revenue: TEV / EBITDA: $314.3 $328.4 $63.3 $25.2 5.2x 13.0x Ocrevus (Neuroscience) Infusion treatment for relapsing and primary progression forms of multiple sclerosis. Perjeta (Oncology) Treatment for HER2-positive breast cancer. Actemra/RoActemra (Immunology) Treatment for moderate-to-severe rheumatoid arthritis and related arthritis diseases. Tecentriq (Oncology) Cancer immunotherapy (alone or in combination) for various types of cancer, such as lung, bladder, breast and liver cancer. Avastin (Oncology) Tumor-starving therapy designed to work with chemotherapy to prevent tumor growth. Hemlibra (Hemophilia) Prophylactic treatment for hemophilia A with and without factor VIII inhibitors. Herceptin (Oncology) Treatment for early-stage HER2-positive breast cancer, stomach cancer, and esophageal cancer. Kadcyla (Oncology) Newer treatment for HER2-positive breast cancer. Spark Therapeutics $4.9 billion Feb 2019 One-Year Price History(1) Intermune $8.9 billion Aug 2014 Goldman Stanley 38 (1) Financial data as of August 31, 2021.
Section 5 Process Recommendations Goldman Stanley 39
Project Jaguar PROCESS RECOMMENDATIONS Key Recommendations Comparison of Targeted and Broad Processes We recommend engaging in targeted discussions with the Tier 1 candidates At the same time, Goldman Stanley will reach out to Tier 2 candidates The M&A process with Tier 1 candidates will take significantly longer, so we recommend parallel processes Depending on the responses from Tier 1 and Tier 2 candidates, Goldman Stanley and Jaguar may approach additional partners Goldman Stanley 40
Project Jaguar PROCESS RECOMMENDATIONS Process Alternatives Comparison of Alternatives and Recommended Hybrid Process Goldman Stanley 41
Project Jaguar PROCESS RECOMMENDATIONS Process Roles and Responsibilities Overview of Phases, Workflow, and Estimated Timing Goldman Stanley 42
Project Jaguar PROCESS RECOMMENDATIONS Illustrative Process Timeline A Targeted Process + Broader Search Could Be Completed in ~6 Months Goldman Stanley 43
Appendix A Financial Projection Assumptions Goldman Stanley 44
Project Jaguar FINANCIAL PROJECTION ASSUMPTIONS Summary of Revenue Forecasts by Scenario Comparison of Management, Consensus, and Downside Cases(1) ($ USD in Millions) Projected FY25 Projected CAGR: Revenue by Segment by Scenario: Management Existing and Acquired Products: Xyrem Xywav Epidiolex/Epidyolex Rylaze Sunosi Zepzelca Other Drugs Risk-Adjusted Pipeline Drug Sales: JZP-385 JZP-150 Total Revenue: Revenue Growth: Units: FY21 FY22 FY23 FY24 FY26 FY27 FY28 FY29 FY30 $ M $ M $ M $ M $ M $ M $ M $ 1,363.4 456.9 684.2 12.0 70.6 223.0 512.2 $ 1,268.0 654.6 1,031.4 144.7 158.6 335.6 537.8 $ 1,178.9 860.9 1,269.8 218.2 264.3 442.5 564.7 $ 1,046.6 1,076.1 1,531.4 243.6 387.9 569.1 587.3 $ 157.8 1,300.1 1,818.0 244.8 508.5 687.1 610.8 $ 108.9 1,287.9 2,131.6 245.4 470.2 650.0 629.1 $ 112.7 1,274.1 2,474.3 245.7 431.4 613.0 648.0 $ 116.7 247.7 2,373.7 233.7 392.3 576.3 661.0 $ 120.8 123.2 2,254.3 221.7 373.5 548.1 674.2 $ 125.0 121.9 2,114.6 209.6 354.5 520.1 687.7 (23.2%) 23.1% 13.4% 37.4% 28.7% 19.1% 3.5% $ M $ M $ M % 3,322.4 40.6% - - 4,130.8 24.3% - - 4,820.1 16.7% 20.8 65.4 18.7 114.4 45.7 5,487.1 (0.7%) 167.6 82.0 5,772.6 5.2% 200.2 178.5 6,178.0 7.0% 209.0 260.8 5,071.0 (17.9%) 210.0 262.1 4,787.9 (5.6%) 211.1 263.4 4,607.9 (3.8%) N/A N/A - 5,526.0 14.6% 6.9% Consensus Existing and Acquired Products: Xyrem Xywav Epidiolex/Epidyolex Rylaze Sunosi Zepzelca Other Drugs Risk-Adjusted Pipeline Drug Sales: JZP-385 JZP-150 Total Revenue: Revenue Growth: $ M $ M $ M $ M $ M $ M $ M $ 1,363.4 456.9 651.6 12.0 70.6 214.8 512.2 $ 1,268.0 617.2 859.5 144.7 158.6 285.2 537.8 $ 1,178.9 765.3 1,015.9 218.2 264.3 357.4 564.7 $ 197.5 880.4 1,186.8 243.6 387.9 431.1 587.3 $ 153.3 1,000.1 1,373.6 244.8 508.5 515.3 610.8 $ 105.8 960.8 1,577.4 245.4 470.2 487.5 629.1 $ 109.5 939.9 1,799.5 245.7 431.4 459.8 648.0 $ 113.4 180.5 1,756.5 233.7 392.3 432.2 661.0 $ 117.3 88.6 1,703.3 221.7 373.5 404.8 674.2 $ 121.5 86.4 1,638.8 209.6 354.5 385.9 687.7 (23.4%) 18.9% 10.8% 37.4% 28.7% 15.6% 3.5% $ M $ M $ M % 3,281.6 38.8% - - 3,871.1 18.0% - - 4,364.6 12.7% - - 3,936.5 (9.8%) 21.8 57.2 13.1 83.8 34.2 100.1 107.1 4,841.1 5.4% 104.5 186.3 4,060.3 (16.1%) 105.0 187.2 3,875.6 (4.5%) 105.5 188.2 3,778.1 (2.5%) N/A N/A - 4,476.6 13.7% 4,594.1 2.6% 4.8% Downside Existing and Acquired Products: Xyrem Xywav Epidiolex/Epidyolex Rylaze Sunosi Zepzelca Other Drugs Risk-Adjusted Pipeline Drug Sales: JZP-385 JZP-150 Total Revenue: Revenue Growth: $ M $ M $ M $ M $ M $ M $ M $ 1,363.4 365.5 651.6 12.0 70.6 214.8 512.2 $ 1,268.0 561.1 756.4 144.7 158.6 251.7 537.8 $ 222.4 631.3 852.6 218.2 264.3 289.3 564.7 $ 191.9 684.8 957.1 243.6 387.9 327.6 587.3 $ 149.0 740.1 1,070.6 244.8 508.5 343.5 610.8 $ 102.8 715.5 1,193.7 245.4 470.2 325.0 629.1 $ 106.4 689.3 1,349.6 245.7 431.4 306.5 648.0 $ 110.2 130.1 1,281.8 233.7 392.3 288.1 661.0 $ 114.0 62.7 1,252.4 221.7 373.5 269.8 674.2 $ 118.0 59.8 1,215.9 209.6 354.5 251.7 687.7 (23.6%) 14.6% 7.2% 37.4% 28.7% 10.8% 3.5% $ M $ M $ M % 3,190.2 35.0% - - 3,678.3 15.3% - - 3,042.9 (17.3%) - - 3,380.2 11.1% - - 3,678.7 11.4 35.9 13.7 50.1 28.6 52.2 89.4 52.5 134.8 3,155.6 (2.6%) 52.8 135.5 3,085.5 (2.2%) N/A N/A - 3,731.3 1.4% 3,855.6 3.3% 3,238.8 (16.0%) 2.7% 8.8% (1) Management based on 8/3 meeting data; Consensus based on Capital IQ forecasts as of 8/31/2022; Downside based on low end of market share/size estimates. Goldman Stanley 45
Project Jaguar FINANCIAL PROJECTION ASSUMPTIONS Xyrem and Xywav Revenue Forecasts Comparison of Management, Consensus, and Downside Cases(1) ($ USD in Millions) Historical FY18 Projected FY25 Revenue Assumptions: Units: FY16 FY17 FY19 FY20 FY21 FY22 FY23 FY24 FY26 FY27 FY28 FY29 FY30 Xyrem and Xywav Assumptions: FY16 FY17 FY18 FY19 FY20 FY21 FY22 FY23 FY24 FY25 FY26 FY27 FY28 FY29 FY30 Total Market Size (# Potential Patients): # Patients On Medication at End of Year: Average # of Patients Throughout the Year: Growth Rate in # of Patients: # People # People # People % 161,470 12,900 12,725 2.6% 162,495 13,525 13,213 3.8% 163,345 14,300 13,913 5.3% 164,120 14,950 14,625 5.1% 165,330 13,400 14,175 (3.1%) 166,157 166,987 167,822 168,661 169,505 170,352 171,204 172,060 172,920 173,785 10,468 (26.2%) 9,184 (12.3%) 8,055 (12.3%) 6,746 (16.3%) 5,085 (24.6%) 3,407 (33.0%) 3,424 0.5% 3,441 0.5% 3,458 0.5% 3,476 0.5% % of Market on Xyrem Medication: % 7.9% 8.1% 8.5% 8.9% 8.6% 6.3% 5.5% 4.8% 4.0% 3.0% 2.0% 2.0% 2.0% 2.0% 2.0% Xyrem - Annual Price Increases Pre-Generics: Xyrem/Xywav - Price Decrease Following Generics: Xyrem - Annual Price Increases Post-Generics: % % % 6.0% 80.0% 3.0% Annual Price Per Patient - Xyrem: Management Consensus Downside $ as Stated $ as Stated $ as Stated $ as Stated $ 87,043 $ 89,816 100,979 $ 112,309 $ 122,875 $ 130,248 $ 130,248 130,248 130,248 138,063 $ 138,063 138,063 138,063 146,347 $ 146,347 146,347 27,613 29,269 155,127 29,269 28,441 $ $ 30,147 31,025 30,147 29,294 $ 31,052 31,956 31,052 30,173 $ 31,983 32,915 31,983 31,078 $ 32,943 33,902 32,943 32,011 $ 33,931 34,919 33,931 32,971 $ 34,949 35,967 34,949 33,960 Growth Rate in Price per Patient: % 13.0% 3.2% 12.4% 11.2% 9.4% 6.0% 6.0% 6.0% (80.0%) 3.0% 3.0% 3.0% 3.0% 3.0% 3.0% Xyrem - Revenue: Annual Growth Rate: $ M % $ 1,107.6 16.0% $ 1,186.7 7.1% $ 1,404.9 18.4% $ 1,642.5 16.9% $ 1,741.8 6.0% $ 1,363.4 (21.7%) $ 1,268.0 (7.0%) $ 1,178.9 (7.0%) $ 197.5 (83.3%) $ 153.3 (22.4%) $ 105.8 (31.0%) $ 109.5 3.5% $ 113.4 3.5% $ 117.3 3.5% $ 121.5 3.5% Xywav - Patients: Growth Rate in # of Patients: # People % 950 4,154 337.3% 5,511 32.7% 6,713 21.8% 7,590 13.1% 8,475 11.7% 8,007 (5.5%) 7,704 (3.8%) 7,399 (4.0%) 7,090 (4.2%) 6,778 (4.4%) N/A N/A N/A N/A % of Market on Xywav: Management Consensus Downside % % % % 0.6% 2.5% 2.5% 2.5% 2.0% 3.3% 3.5% 3.3% 3.0% 4.0% 4.5% 4.0% 3.3% 4.5% 5.5% 4.5% 3.5% 5.0% 6.5% 5.0% 3.7% 4.7% 6.3% 4.7% 3.5% 4.5% 6.1% 4.5% 3.3% 4.3% 5.9% 4.3% 3.1% 4.1% 5.7% 4.1% 2.9% 3.9% 5.5% 3.9% 2.7% Annual Price Per Patient - Xywav: $ as Stated $ 64,269 110,000 112,000 114,000 116,000 118,000 120,000 122,000 24,400 12,500 12,750 Growth Rate in Price per Patient: % 71.2% 1.8% 1.8% 1.8% 1.7% 1.7% 1.7% (80.0%) (48.8%) 2.0% Xywav - Revenue: Annual Growth Rate: $ M % $ - $ - $ - $ - $ 15.3 $ 2893.5% 456.9 $ 617.2 35.1% $ 765.3 24.0% $ 880.4 15.0% $ 1,000.1 13.6% $ 960.8 (3.9%) $ 939.9 (2.2%) $ 180.5 (80.8%) $ 88.6 $ 86.4 (2.5%) (50.9%) (1) Management based on 8/3 meeting data; Consensus based on Capital IQ forecasts as of 8/31/2022; Downside based on low end of market share/size estimates. Goldman Stanley 46
Project Jaguar FINANCIAL PROJECTION ASSUMPTIONS Historical and Projected Unlevered Free Cash Flow Management Case Estimates(1) ($ USD in Millions) Historical FY18 1,890.9 16.8% Projected FY25 5,487.1 $ (0.7%) Normalized FY31 4,515.7 $ (2.0%) Unlevered Free Cash Flow Projections: Total Revenue: Revenue Growth: Units: $ M % FY16 1,488.0 12.3% FY17 1,618.7 FY19 2,161.8 14.3% FY20 2,363.6 FY21 3,322.4 $ 40.6% FY22 4,130.8 $ 24.3% FY23 4,820.1 $ 16.7% FY24 5,526.0 $ 14.6% FY26 5,772.6 $ FY27 6,178.0 $ FY28 5,071.0 $ (17.9%) FY29 4,787.9 $ (5.6%) FY30 4,607.9 $ (3.8%) 8.8% 9.3% 5.2% 7.0% Operating Income (EBIT): Operating (EBIT) Margin: $ M % 615.4 41.4% 613.8 37.9% 657.7 34.8% 642.3 29.7% 765.5 32.4% 898.1 27.0% 1,123.0 27.2% 1,362.6 28.3% 1,601.5 29.0% 1,480.7 27.0% 1,538.5 26.7% 1,646.5 26.7% 1,102.5 21.7% 941.8 19.7% 826.8 17.9% 1,514.1 33.5% (-) Taxes, Excluding Effect of Interest: $ M (92.3) (92.1) (98.7) (96.4) (114.8) (134.7) (168.4) (204.4) (240.2) (222.1) (230.8) (247.0) (165.4) (141.3) (124.0) (227.1) Net Operating Profit After Tax (NOPAT): $ M 523.1 521.8 559.1 546.0 650.6 763.4 954.5 1,158.2 1,361.3 1,258.6 1,307.8 1,399.5 937.1 800.5 702.8 1,287.0 Total Adjustments for Non-Cash Charges: $ M 71.1 (43.9) 140.0 140.3 170.9 461.2 577.4 603.3 632.1 664.4 695.8 729.5 754.5 776.1 795.9 185.1 (+/-) Changes in Operating Assets & Liabilities: % Change in Revenue: $ M % (20.9) (12.8%) 26.8 20.5% 21.1 7.7% (154.2) (56.9%) (85.4) (42.3%) (160.8) (16.8%) (135.5) (16.8%) (115.6) (16.8%) (118.3) (16.8%) (16.8%) 6.5 (47.9) (16.8%) (68.0) (16.8%) 185.6 (16.8%) 47.5 30.2 (16.8%) 15.5 (16.8%) (16.8%) (-) Capital Expenditures: % Revenue: $ M % (9.7) 0.7% (29.0) 1.8% (20.4) 1.1% (40.1) 1.9% (15.0) 0.6% (39.9) 1.2% (49.6) 1.2% (57.9) 1.2% (66.4) 1.2% (65.9) 1.2% (69.4) 1.2% (74.2) 1.2% (60.9) 1.2% (57.5) 1.2% (55.4) 1.2% (54.3) 1.2% (-) Intangible Purchases: % Revenue: $ M % (150.0) 10.1% - (111.1) 5.9% (80.5) 3.7% (113.0) 4.8% (162.5) 4.9% (202.1) 4.9% (235.8) 4.9% (270.3) 4.9% (268.4) 4.9% (282.4) 4.9% (302.2) 4.9% (248.1) 4.9% (234.2) 4.9% (225.4) 4.9% (220.9) 4.9% 0.0% (-) Commercial Milestone Payments: $ M - - - - - (100.0) (100.0) (100.0) (100.0) (100.0) (100.0) - - - - - (-) Acquisitions: $ M (1,502.4) - - (55.1) - (6,234.8) - - - - - - - - - - Annual Unlevered Free Cash Flow: Annual UFCF Growth Rate: $ M % (1,088.8) N/A (143.7%) 475.7 588.7 23.8% 356.4 (39.5%) 608.1 70.6% (5,473.5) (1000.1%) 1,044.7 (119.1%) 1,252.2 19.9% 1,438.3 14.9% 1,495.1 4.0% 1,504.0 0.6% 1,684.6 12.0% 1,568.1 (6.9%) 1,332.3 (15.0%) 1,248.0 (6.3%) 1,212.4 (2.9%) Annual EBITDA: Annual EBITDA Growth Rate: EBITDA Margin: $ M % % N/A 729.2 779.0 6.8% 48.1% 874.5 12.3% 46.2% 1,012.5 15.8% 46.8% 1,043.7 3.1% 44.2% $ 1,451.0 39.0% 43.7% $ 1,818.2 25.3% 44.0% $ 2,093.4 15.1% 43.4% $ 2,371.4 13.3% 42.9% $ 2,287.3 (3.5%) 41.7% $ 2,384.2 4.2% 41.3% $ 2,533.6 6.3% 41.0% $ 2,011.1 (20.6%) 39.7% $ 1,873.0 (6.9%) 39.1% $ 1,780.1 (5.0%) 38.6% $ 1,748.2 (1.8%) 38.7% 49.0% Normalized Net Income to Common: Annual Net Income Growth Rate: $ M % N/A 469.5 454.7 (3.2%) 490.1 7.8% 480.5 (2.0%) 562.9 17.2% 552.0 (1.9%) 743.2 34.6% 946.8 27.4% 1,149.9 21.4% 1,047.2 (8.9%) 1,096.4 4.7% 1,188.2 8.4% 725.7 (38.9%) 589.1 (18.8%) 491.4 (16.6%) Goldman Stanley 47 (1) Management based on 8/3 meeting data.
Appendix B Valuation Data Goldman Stanley 48
Project Jaguar VALUATION DATA Comparable Public Companies U.S.-Based Specialty Pharma Companies with LTM Revenue Between $1 and $5 Billion ($ USD in Millions) Operating Statistics Capitalization Equity Value(1) 22,515.3 $ 17,130.0 31,637.3 15,908.6 3,472.2 10,385.0 6,394.1 9,863.6 2-Year Revenue CAGR 2-Year EBITDA CAGR Revenue(2) CY 22 4,710.6 $ 3,447.9 2,230.2 2,188.1 1,462.9 1,867.2 1,636.6 1,408.5 EBITDA(2) CY 22 1,263.5 $ 1,135.2 Normalized Net Income(2)(3) CY 21 CY 22 489.1 $ $ 668.6 (418.0) 226.4 426.0 754.0 200.9 274.5 Enterprise Value(1) 25,066.6 $ 14,886.5 29,155.8 15,517.7 3,853.0 7,855.3 4,628.3 8,504.1 EBITDA Margin CY 21 25.2% 23.9% (25.2%) (0.4%) 34.4% 42.1% 11.2% 24.7% Company Name Catalent, Inc. Incyte Corporation Seagen Inc. BioMarin Pharmaceutical Inc. Emergent BioSolutions Inc. United Therapeutics Corporation Exelixis, Inc. Neurocrine Biosciences, Inc. CY 21 4,253.2 $ 2,844.0 1,505.0 1,853.4 1,797.4 1,671.2 1,381.2 1,136.2 CY 23 5,118.4 $ 4,005.7 3,205.6 2,747.7 1,300.2 2,129.8 1,988.7 1,707.3 CY 21 1,071.1 $ (378.9) 618.2 704.2 154.7 280.1 CY 23 1,412.6 $ 1,638.0 1,244.9 CY 23 LTM CY 22 CY 23 630.1 1,011.4 28.8 470.4 264.8 855.0 295.0 421.9 $ 729.6 1,319.0 583.8 818.2 224.0 1,086.0 453.0 602.6 9.7% 18.7% 45.9% N/A 21.8% N/A (14.9%) 12.9% 20.0% 22.6% 14.8% 55.4% 23.9% 17.0% 27.4% 6.3% 33.8% 39.2% 9.7% 24.7% 26.8% 32.9% 6.1% 15.9% 28.7% 53.1% 15.4% 37.5% 27.6% 40.9% 20.1% 31.3% 25.0% 58.5% 24.7% 44.8% 678.7 136.3 347.0 420.3 991.0 252.3 528.4 645.2 858.7 325.1 (7.7) (27.5%) 33.0% 78.1% 65.3% 491.0 765.3 Maximum 75th Percentile Median 25th Percentile Minimum 31,637.3 $ 18,476.3 13,146.8 8,996.2 3,472.2 29,155.8 $ 17,904.9 11,695.3 7,048.6 3,853.0 $ 4,253.2 2,101.1 1,734.3 1,474.1 1,136.2 $ 4,710.6 2,534.6 2,027.7 1,593.1 1,408.5 $ 5,118.4 3,405.6 2,438.7 1,918.4 1,300.2 1,071.1 685.1 449.2 114.1 (378.9) $ $ 1,263.5 1,027.1 474.3 323.3 136.3 $ 1,638.0 1,286.8 812.0 606.6 325.1 $ 754.0 534.0 350.3 220.0 (418.0) $ 1,011.4 686.3 446.2 287.4 28.8 $ 1,319.0 885.1 666.1 551.1 224.0 45.9% 22.0% 19.3% 12.1% (14.9%) 78.1% 62.8% 44.2% 19.4% (27.5%) 39.2% 29.0% 24.3% 15.2% 6.3% 42.1% 27.5% 24.3% 8.3% (25.2%) 53.1% 34.1% 27.8% 15.7% 6.1% 58.5% 41.9% 29.4% 24.9% 20.1% Jaguar $ 8,306.0 14,932.5 $ $ 3,281.6 $ 3,871.1 $ 4,364.6 $ 1,434.5 $ 1,710.6 $ 1,905.5 $ 538.2 $ 653.6 $ 791.4 15.3% 15.3% 41.0% 43.7% 44.2% 43.7% Valuation Statistics Capitalization Equity Value(1) 22,515.3 $ 17,130.0 31,637.3 15,908.6 3,472.2 10,385.0 6,394.1 9,863.6 TEV / Revenue(1)(2) CY 22 5.9 x 5.2 x 19.4 x 8.4 x 2.1 x 4.7 x 3.4 x 7.5 x TEV / EBITDA(1)(2) CY 22 23.4 x 21.9 x NM P / E(1)(2)(3) CY 22 Enterprise Value(1) 25,066.6 $ 14,886.5 29,155.8 15,517.7 3,853.0 7,855.3 4,628.3 8,504.1 Company Name Catalent, Inc. Incyte Corporation Seagen Inc. BioMarin Pharmaceutical Inc. Emergent BioSolutions Inc. United Therapeutics Corporation Exelixis, Inc. Neurocrine Biosciences, Inc. CY 21 CY 23 CY 21 CY 23 CY 21 CY 23 5.3 x 4.3 x 13.1 x 7.1 x 2.6 x 4.2 x 2.8 x 6.0 x 4.9 x 3.7 x 9.1 x NM 5.6 x NM 3.0 x 3.7 x 2.3 x 5.0 x 19.8 x 13.1 x 17.7 x 9.1 x 45.2 x NM 18.1 x 11.9 x 6.3 x 9.4 x 11.1 x 46.0 x 25.6 x 35.7 x 16.9 x 30.9 x 13.0 x 54.2 x 19.4 x 15.5 x 9.6 x 14.1 x 16.4 x NM 44.7 x 9.2 x 7.9 x 18.3 x 16.1 x 70.3 x 8.1 x 13.8 x 31.8 x 35.9 x 33.8 x 13.1 x 12.1 x 21.7 x 23.4 x 6.2 x 11.2 x 29.9 x 30.4 x Maximum 75th Percentile Median 25th Percentile Minimum 31,637.3 $ 18,476.3 13,146.8 8,996.2 3,472.2 29,155.8 $ 17,904.9 11,695.3 7,048.6 3,853.0 19.4 x 7.7 x 5.6 x 4.4 x 2.1 x 13.1 x 6.3 x 4.8 x 3.9 x 2.6 x 9.1 x 5.1 x 4.3 x 3.5 x 2.3 x 30.4 x 28.3 x 22.7 x 13.8 x 6.2 x 44.7 x 19.1 x 16.1 x 11.1 x 7.9 x 45.2 x 17.8 x 11.5 x 9.3 x 6.3 x 70.3 x 41.0 x 31.8 x 19.7 x 8.1 x 35.7 x 28.6 x 21.7 x 15.0 x 12.1 x 54.2 x 22.3 x 15.9 x 13.8 x 9.6 x Jaguar $ 8,306.0 14,932.5 $ 4.6 x 3.9 x 3.4 x 10.4 x 8.7 x 7.8 x 15.4 x 12.7 x 10.5 x (1) Market data based on closing prices as of 8/31/2021. (2) Forecasts based on Capital IQ consensus estimates. (3) Normalized Net Income excludes non-recurring expenses. Goldman Stanley 49
Project Jaguar VALUATION DATA Precedent Transactions U.S.-Based Bio/Pharma Sellers with LTM Revenue Above $500 Million Since 8/31/2011 ($ USD in Millions) Jaguar - Comparable M&A Transactions Operating Metrics Valuation Multiples Premiums Paid to Undisturbed TEV / TEV / LTM LTM LTM LTM Revenue EBITDA Revenue EBITDA 2020-12-12 $ 40,021.1 $5,862.4 $3,061.8 2018-01-22 11,037.8 1,168.5 474.8 2016-01-11 35,218.9 6,148.0 2,105.0 2014-11-17 68,725.9 7,003.2 2,330.0 2012-06-29 6,637.7 651.7 (449.6) 2017-04-24 4,789.0 1,101.9 445.9 2016-12-15 5,500.0 1,000.0 344.0 2016-09-06 4,078.8 564.3 0.6 2016-08-22 14,003.7 1,027.1 456.5 2015-03-04 20,166.7 816.1 112.9 2015-02-22 16,137.2 1,133.5 154.8 Transaction Enterprise Value(1) Share Price 1-Week Prior 45.5% 64.7% 48.9% 76.7% 103.0% 41.2% N/A 53.4% 106.9% 56.3% 46.5% 1-Day Prior 44.9% 63.8% 37.5% 54.2% 101.4% 34.8% 1-Month Prior 37.4% 95.7% 43.7% 75.1% 73.5% 51.9% N/A 47.9% 127.8% 64.8% 57.1% Acquirer Name Target Name Date AstraZeneca PLC Sanofi S.A. Shire plc Allergan plc (fka: Actavis plc) Bristol-Myers Squibb Company Fresenius Kabi USA, LLC Lonza Group Ltd Danaher Corporation Pfizer Inc. AbbVie Inc. Valeant Pharmaceuticals International Inc. (nka:Bausch Health Americas, Inc.) Merck & Co., Inc. Mallinckrodt Public Limited Company Alexion Pharmaceuticals, Inc. Bioverativ Inc. Baxalta Incorporated Allergan, Inc. Amylin Pharmaceuticals, LLC Akorn, Inc. Capsugel Inc. Cepheid Medivation, Inc. Pharmacyclics LLC Salix Pharmaceuticals Ltd. 6.8 x 9.4 x 5.7 x 9.8 x 10.2 x NM 4.3 x 5.5 x 7.2 x NM 13.6 x 24.7 x NM 14.2 x NM 13.1 x 23.2 x 16.7 x 29.5 x 10.7 x 16.0 x N/A 54.0% 118.0% 38.6% 43.9% 30.7 x Cubist Pharmaceuticals LLC Questcor Pharmaceuticals, Inc. (nka:Mallinckrodt ARD Inc.) Forest Laboratories, LLC Aptalis Holdings Inc. Onyx Pharmaceuticals, Inc. Medicis Pharmaceutical Corporation 2012-09-03 2,328.8 763.7 191.4 2014-12-08 9,488.3 1,164.5 203.6 2014-04-07 5,300.3 890.9 516.9 8.1 x 5.9 x 46.6 x 10.3 x 37.2% 26.9% 34.5% 38.6% 44.2% 32.7% Allergan plc (fka: Actavis plc) Forest Laboratories, LLC Amgen Inc. Valeant Pharmaceuticals International Inc. (nka:Bausch Health Americas, Inc.) 2014-02-18 22,128.8 3,371.4 418.3 2014-01-08 2,900.0 700.2 275.6 2013-08-25 9,253.8 516.0 (151.5) 6.6 x 4.1 x 17.9 x NM 3.0 x 52.9 x 10.5 x N/A 25.3% 29.9% 27.9% N/A N/A 44.0% 39.4% 52.8% 35.4% 29.8% 33.7% 12.2 x Maximum 68,725.9 $ 20,166.7 9,488.3 5,300.3 2,328.8 7,003.2 $ 1,168.5 1,027.1 763.7 516.0 3,061.8 $ 474.8 344.0 154.8 (449.6) 24.7 x 10.2 x 7.2 x 5.7 x 3.0 x 52.9 x 29.8 x 16.4 x 11.8 x 10.3 x 118.0% 54.1% 43.9% 37.3% 25.3% 106.9% 60.5% 48.9% 39.9% 29.9% 127.8% 69.1% 47.9% 35.5% 27.9% 75th Percentile Median 25th Percentile Minimum (1) Transaction Enterprise Value based on Purchase Equity Value Cash Other Non-Core Assets + Debt + Preferred Stock + Noncontrolling Interests + Other Long-Term Funding Sources. Goldman Stanley 50