Project Team Communication and Expectation Management Insights
Explore effective communication strategies and channels for successful project management as outlined in Chapter 5 of "Project Team Leadership and Communication" by Samuel Malachowsky. Understand the importance of communication, channels of communication, various communication concepts, and different communication styles such as push, pull, and hybrid. Enhance your communication skills to effectively engage with stakeholders and team members.

Download Presentation

Please find below an Image/Link to download the presentation.
The content on the website is provided AS IS for your information and personal use only. It may not be sold, licensed, or shared on other websites without obtaining consent from the author. If you encounter any issues during the download, it is possible that the publisher has removed the file from their server.
You are allowed to download the files provided on this website for personal or commercial use, subject to the condition that they are used lawfully. All files are the property of their respective owners.
The content on the website is provided AS IS for your information and personal use only. It may not be sold, licensed, or shared on other websites without obtaining consent from the author.
E N D
Presentation Transcript
Communication and Expectation Management Communication success for teams and stakeholders Designed for chapter 5, pages 149-178 of Project Team Leadership and Communication by Samuel Malachowsky, ISBN 9781732378902, 9781732378919.
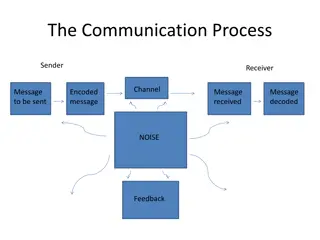
Project Communication Important because: Stakeholders affect projects whether you communicate or not Because of technology, customers expect more interaction Team members Leadership and motivation factors can have a huge effect on the project Often are split between multiple projects Interactive communication is considered ideal (each party is able to respond, ask for clarification, etc.) This often is impossible or impractical, so one-way communication is used Malachowsky, Samuel. Project Team Leadership and Communication. Lintwood Press. 2018. p. 149-150.
Channels of Communication A communication channel is the path through which a communication must travel Leaders and team members must maintain channels of communication with each other 6 Channels 10 Channels 15 Channels As the number of team members increase, the number of channels increases much quicker Diagrams: Malachowsky, Samuel. Project Team Leadership and Communication. Lintwood Press. 2018. p. 151.
Communication Concepts There are dozens of communication channels available at any given time: Face-to-Face Message Boards Social Media Multi-Channel Online Video Posts Text Messages Photo Sharing Email Video Conference Postal Mail Television Print Media Instant Messages Written Notes Advertisement Telephone Blogs and many more Additionally there are types or categories of communication: Internal / External Formal / Informal Vertical / Horizontal Written / Oral Verbal / Nonverbal / Paralingual And there are potential blockers to communication efforts: Language and Culture Interruptions Technical Issues Distractions such as fatigue Negativity or hostility Context known by only one party Incorrect assumptions Receiver not actively listening Malachowsky, Samuel. Project Team Leadership and Communication. Lintwood Press. 2018. p. 152.
Push / Pull / Hybrid Communication Interactive Communication is ideal, but not always available or practical Push/Pull Communication share a weakness: Sender is only sure it was sent, not if it was received or understood Push Communication is one-way communication sent to one or more recipients Email, radio broadcasts, and postal main are common examples Pull Communication allows the recipient(s) to receive the communication at will Websites and bulletin boards are common examples Hybrid Communication combines push and pull communication, capturing the strengths of both Sending an email which includes a link to a website or file storage area is a common example By pushing the communication which includes the ability for the recipient to pull in the future, the sender increases the chance that the recipient(s) will receive the message Malachowsky, Samuel. Project Team Leadership and Communication. Lintwood Press. 2018. p. 155-158.
Meeting Issues Meetings have many common complaints: My time could be better spent Discussion or debate is out of control Facilitator unprepared Bad timing (time of day, week, business cycle) Most of what was discussed wasn t relevant to me The subject isn t appropriate for a meeting ( status meetings ) The wrong attendees It felt disorganized Attendees are unprepared Distractions / Poor timing Interpersonal issues Malachowsky, Samuel. Project Team Leadership and Communication. Lintwood Press. 2018. p. 159-160.
Meeting Success Manage time properly Proper advanced notice, proper frequency of meetings Time management in the meeting so that topics are not over or under-discussed Prepare beforehand Prepare and send agenda (many templates are available online or within organizations) Names, roles, location, date/time Objective / purpose for the meeting Schedule of topics with specific timeframes Ensure technology (projector, online meeting software, document storage) is all set Document and follow up Record and publish clear meeting results, decisions, and action items Ensure that important stakeholders receive and acknowledge documentation Malachowsky, Samuel. Project Team Leadership and Communication. Lintwood Press. 2018. p. 161-162.
Meeting Agenda Meeting Title / Subject Date, Time, Location, Online/Telephone Details Facilitator/Called By Name Attendee Names and Titles In-Meeting Roles (Presenter, Timekeeper, Notekeeper) Start Time End Time Facilitator /Presenter Name(s) Subject / Discussion Topic / Notes Start Time End Time Facilitator /Presenter Name(s) Subject / Discussion Topic / Notes Start Time End Time Facilitator /Presenter Name(s) Subject / Discussion Topic / Notes Start Time End Time Facilitator /Presenter Name(s) Subject / Discussion Topic / Notes Where meeting minutes, actions, decisions, etc. are stored after the meeting
Ethical Communication Communication presents the majority of ethical decisions for most individuals Ethics focus on truthfulness Honesty before the project begins Ensuring that the project team and stakeholders are presented with an honest view of circumstances Trying to understand the truth Remember that perceptions can be inaccurate. Seek the whole truth Being truthful in all communications Stressful or less-than-ideal circumstances make this difficulty. Trust is built in the bad times, not the good Creating an environment where others tell the truth As a leader or peer, consistently telling the truth communicates to others that truthfulness is the only acceptable option Malachowsky, Samuel. Project Team Leadership and Communication. Lintwood Press. 2018. p. 162-163.
Communicating Metrics and Reports Metrics are a useful quantitative representation of a project attribute, which help leaders or team members make decisions about the project Private metrics are known only to the team and risk misinterpretation if shared Public metrics are designed to be shared outside the team for comparison across projects Reports are more complex representations of the project designed to be communicated to stakeholders and typically contain multiple metrics Making metrics and reports useful requires attention to several aspects Level of detail as well as ethical and appropriate interpretation for stakeholders Choosing an appropriate communication channel Considering the role of the recipient, as well as their preferences An appropriate understanding of what the information is ultimately going to be used for Malachowsky, Samuel. Project Team Leadership and Communication. Lintwood Press. 2018. p. 164-165.
Example Project Metrics (1 of 2) Cycletime measures the average amount of time it takes to complete a cycle. Defining a cycle is up to the team it can be a single phase or the entire project. Schedule or Cost Variance demonstrates how far the expected value (baseline) is from the actual value. Related to a project s Earned Value. Resource Utilization tracks how effectively of the team s available work hours are being utilized. A percentage significantly below 100% may indicate wasted time, and over 100% could lead to burn-out. Similar metrics exist for other (non-human) resources. Diagrams: Malachowsky, Samuel. Project Team Leadership and Communication. Lintwood Press. 2018. p. 166.
Example Project Metrics (2 of 2) Requirements/Specifications Volatility measures the number of changes to requirements/specifications as the project proceeds. These changes often have significant impacts on the productivity of the team. Total Risk Exposureis the sum of a project s individual risk exposures. The result is the expected total impact to resources or schedule. Customer Satisfaction is an important metric to many organizations. Measured in various ways (surveys, etc.). Understanding why customer satisfaction is where it is represents a much more difficult task. Diagrams: Malachowsky, Samuel. Project Team Leadership and Communication. Lintwood Press. 2018. p. 166-167.
Example Project Reports (1 of 3) Status Reports indicate the overall condition of a project. Overall health Schedule/budget status Issues/risks Almost any relevant metric can be included Trend/Forecasting Reports extrapolate important project data, giving insight into important factors of the project. Is performance improving or deteriorating? Will the data and its forecast factor into important decisions? Sources, justifications, and expected ranges help make the report more relevant/readable Automatically generated reports can be extremely useful here Data/Metrics: Cycletime, Schedule, Cost, etc. Quad Charts are a useful example of a status report Limited to one side of one page or one presentation slide Completed Since Last Report Plans For Current Period Risks & Issues Needs & Discussion Diagrams: Malachowsky, Samuel. Project Team Leadership and Communication. Lintwood Press. 2018. p. 167-168.
Example Project Reports (2 of 3) Variance Reports measure how actual results compare to the expected value, or baseline. Both overspending and underspeinding time or resources can represent a problem The expected values may not always be constant/linear. Projects often plan to work and spend resources at varying rates Often, more data is included to provide clarity Data/Metrics: Schedule Variance, Cost Variance, analysis/clarification where needed Earned Value Reports are similar to Trend/Fore- casting and Variance Reports, but follow a specific method. Actual, or Earned Value are plotted against expected value. In an ideal project, both graphed lines would match perfectly. A gap indicates variance Some project management software automatically generates this report Data/Metrics: Earned Value, Planned Value Diagrams: Malachowsky, Samuel. Project Team Leadership and Communication. Lintwood Press. 2018. p. 169.
Example Project Reports (3 of 3) Lessons Learned Reports present an opportunity for the project team to review, document, learn from, and communicate what went well and what went poorly throughout the project. Often three questions are asked: What should the team start doing? What should the team stop doing? What should the team continue doing? Also known as a Postmortem, which implies lessons learned activities are only completed at the end of a project. In reality, they should happen throughout, and team can benefit immediately Previous Lessons Learned reports can also benefit teams completing projects in the future Diagram: Malachowsky, Samuel. Project Team Leadership and Communication. Lintwood Press. 2018. p. 170.
Stakeholder Expectation Management Stakeholders fall into 2 groups Those who affect the project: often the most apparent to the team and the most demanding Those who are affected by the project: often easier to ignore Expectations have a direct connection to perception, and perception is influenced by communication. Several factors can affect this: Stakeholders previous projects and experiences Patterns of communication and normal rhythms of the organizational environment Expectations of individual stakeholders: simply asking is often most effective here Previous commitments made by the project team. These should be carefully recorded and considered Hard data: numbers (metrics, reports, etc.) and appropriate context are extremely valuable Malachowsky, Samuel. Project Team Leadership and Communication. Lintwood Press. 2018. p. 171-172.
Summary and Conclusions Teams may not give communication enough consideration because in general communication is a large part of everyday life Communication requires careful planning, and should consider factors such as the appropriate channel and potential blockers. Carefully consider whether interactive, push, pull, and hybrid communication types are appropriate Team meetings, a major area of difficulty, should be properly planned/executed External communication affects the expectations of stakeholders Communication represents the majority of ethical considerations for project teams When communicating with metrics and reports, special consideration must be given to how they are perceived. Provide appropriate interpretation and context


")
")
")
")
")