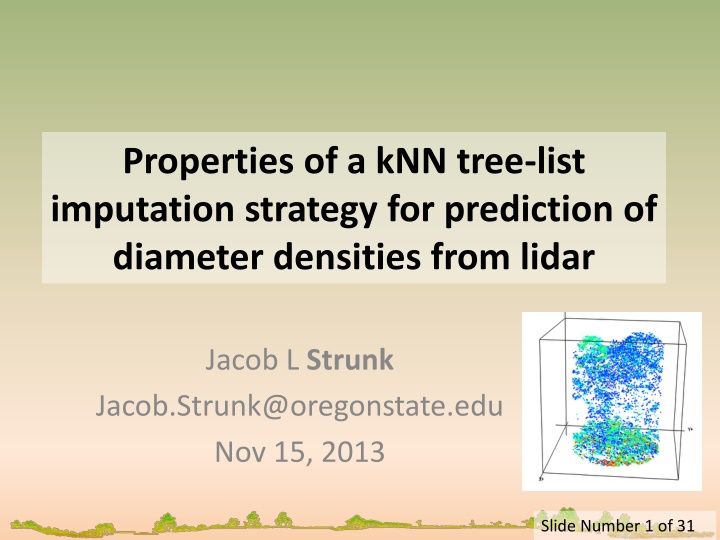
Properties of kNN Tree-List Imputation Strategy for Diameter Densities Prediction
In this study, the effectiveness of a kNN tree-list imputation strategy for predicting diameter densities from LiDAR data is investigated, highlighting comparisons with traditional approaches and the practical implications for forest inventory applications.

Download Presentation

Please find below an Image/Link to download the presentation.
The content on the website is provided AS IS for your information and personal use only. It may not be sold, licensed, or shared on other websites without obtaining consent from the author.If you encounter any issues during the download, it is possible that the publisher has removed the file from their server.
You are allowed to download the files provided on this website for personal or commercial use, subject to the condition that they are used lawfully. All files are the property of their respective owners.
The content on the website is provided AS IS for your information and personal use only. It may not be sold, licensed, or shared on other websites without obtaining consent from the author.
E N D
Presentation Transcript
Properties of a kNN tree-list imputation strategy for prediction of diameter densities from lidar Jacob L Strunk Jacob.Strunk@oregonstate.edu Nov 15, 2013 Slide Number 1 of 31
Note Diameter Density in this context is referring to the probability density function Proportion of trees in a diameter class (dcl) p(d) dcl (cm) Slide Number 2 of 31
Please! Share your critiques It will help the manuscript Slide Number 3 of 31
Overview Conclusion Context kNN Tree List some background Study objectives Indices of diameter density prediction performance Results Conclusion Revisited Slide Number 4 of 31
Conclusion kNN diameter density estimation with LiDAR was comparable with or superior (precision) to a Post- stratification approach with 1600 variable radius plots Equivalent: Stratum, Tract Superior: Plot, Stand Mahalanobis with k=3, lidar P30 and P90 metrics worked well Stratification did not help may be due to sample size (~200) Slide Number 5 of 31
Aside: Brief Survey 1. Who uses diameter distributions in day to day work? 2. For distribution users: Inventory type? - Stand, Stratum, 2-stage, lidar 3. Approach? parametric, non-parametric 4. Sensitivity to noise in distribution? Very, not very, what noise 5. What measure of reliability do you use for diameter information? Index of fit P-value None CIs for bins Other p(d) dcl (cm) Slide Number 6 of 31
Study Context Lidar approaches can support many applications in forest inventory and monitoring But - Diameter densities are required for forestry applications - Lidar literature (on diameters) unclear on performance Field-Derived y Problems: Performance measures: p-values & indices* No comparisons with traditional approaches No Asymptotic properties Lidar x *I am OK, with indices, but the suggested indices may not be enough Slide Number 7 of 31
kNN a flexible solution Multivariate Conceptually simple Works well with some response variables Realistic answers (can t over-extrapolate) Can impute a tree list directly (kNN TL) No need for theoretical distribution Slide Number 8 of 31
KNN weaknesses Error statistics often not provided Sampling inference not well described in literature People don t understand limitations in results Can t extrapolate Imputed values may be noisier than using mean Poorer performance than OLS (NLS) usually Slide Number 9 of 31
Plot Color = x values kNN TL Imputation Impute: Substitute for a missing value 1. Measure X everywhere (U) ? =f(.75) 2. Measure Y on a sample (s) ?=.75 ?=.75 Auxiliary Data Forest (e.g.) 3. Find distance from s to U In X space height, cover, etc. 4. Donate y from sample to nearest (X space) neighbors Bring distance-weighted tree list ?=.25 ? = f(.25) Slide Number 10 of 31
kNN Components k (number of neighbors imputed) Distance metric (Euc., Mah., MSN, RF) Explanatory variables Age, Lidar height, lidar cover, FWOF (modeled) Response variables (only for MSN and RF) Vol, BA, Ht, Dens., subgroups (> 5 in., > ) Stratification dominant species group (5) Hardwood, Lobl. Pine, Longl. Pine, Slash P., Slide Number 11 of 31
Distance Metrics I assume this means shifted and rescaled. yaImpute documentation: normalized Euclidean distance is computed in a X space. Mahalanobis distance is computed in its namesakes space. MSN distance is computed in a projected canonical space. randomForest distance is one minus the proportion of randomForest trees where a target observation is in the same terminal node as a reference observation Slide Number 12 of 31
Study Objectives Enable relative, absolute, comparative inference for diameter density prediction Traditional inventory system Contrast kNN and performances TIS Evaluate kNN strategies for diameter density prediction Slide Number 13 of 31
Enable relative, absolute, comparative inference I will argue that we have already settled on some excellent measures of performance: Coefficient of determination (R2) Root mean square error (RMSE) Standard error (sample based estimator of sd of estimator) Very convenient for inference Straight forward to translate to diameter densities Slide Number 14 of 31
Indices Residual Computation Computed with Leave One Out (LOO) cross-validation LOO cross-validation 1. Omit one plot 2. Fit model 3. Predict omitted plot 4. Compute error metric (observed vs predicted) 5. Repeat n-1 times After LOO cross-validation 1. Compute indices from vector of residual Slide Number 15 of 31
Proposed Indices index I Similar to coefficient of determination Relative inference ( 1 I index = i j i Variability of predictions around observed densities ) 2 i d d ij ij j ( ) 2 d d j ij Variability around population density given a = plot given a = j d diameter bin observed = density diameter in class j on plot i ij predicted = density diameter in class j on plot i d ij mean = density diameter in class j for plots. all d ij Slide Number 16 of 31
Proposed Indices index K Similar to model RMSE absolute (and comparative) inference ( ) 2 i d d ij ij j = index K n = given a = plot i = n 1 number of sample plots. i Slide Number 17 of 31
Proposed Indices index kn Similar to standard error (estimated sd of estimator) comparative inference k increases n as K n n K = k n n sample = size n density a for E[K] = estimator samples a from of size n. K n Slide Number 18 of 31
Why these indices Index I Intuitive inference: how much variation did we explain Doesn t work well when comparing 2 designs Index K an absolute measure of prediction performance that to compare models from different sampling designs Index kn Look at asymptotic estimation properties with different designs and modeling strategies Slide Number 19 of 31
Study Area Savannah River Site South Carolina 200 k acres & wall to wall lidar ~200 FR plots (40 trees / plot on average) 1600 VR plots (10 trees / plot on average) Slide Number 20 of 31
FR Design 200 Fixed radius 1/10th or 1/5th acre plots Distributed across size and species groups Survey-grade GPS positioning Slide Number 21 of 31
Traditional Inventory System (TIS) Traditional i.e. a fairly common approach Design: ~200K acres of forest on Savannah River Site 1607 Variable Radius Plots ~gridded Post-stratification on field measurements <Best-case scenario for reference method> Height Cover Dominant Species Group ->63 Strata 7000+ Stands (~30 acres each) Serves as baseline or reference approach Lots of people familiar with its performance Slide Number 22 of 31
Results 1. Compare kNN with TIS Plot Stratum Stand Tract 2. kNN components K & distance metric predictors responses stratification Slide Number 23 of 31
K = Quasi RMSE (smaller is better) Results: Point /Plot = . 0 = 48 K TIS K . 0 14 kNN kNN performance >> TIS performance Reasonable result kNN can vary with lidar height & cover metrics Single density within a stratum for TIS Slide Number 24 of 31
Results Stratum: Setup 63 Strata 200 FR plots ~ 3 FR plots / stratum Stratum-level kNN performance: Single Stratum = . 0 14 K kNN . 0 14 3= k 3 Slide Number 25 of 31
Results Stand: Setup 7000+ Stands 200 FR plots ~ 0 FR plots / stand No asymptotic properties Stand-level kNN performance: Stands w/in Single Stratum = . 0 14 K kNN Slide Number 26 of 31
TIS vs kNN K = Quasi RMSE (smaller is better) = . 0 48 K TIS Stratum Level Performance (63 TIS Strata) = . 0 14 K kNN KkNN K = k n n *Stand* level performance (7000+ stands) kn = Quasi Standard Error (smaller is better) Tract performances (kn) were equivalent for kNN and TIS Slide Number 27 of 31
Tract Equivalent performance kNN and TIS kn TIS: 0.12 kn kNN: 0.10 Slide Number 28 of 31
kNN strategy Components Slide Number 29 of 31
New Index Index I Similar to coefficient of determination (R2) Closer to 1.0 is better Slide Number 30 of 31
kNN: k & distance metric 0.80 0.75 0.70 0.65 Index I Euc. Mah. 0.60 MSN 0.55 RF 0.50 0.45 1 3 5 10 15 20 k Slide Number 31 of 31
kNN: Predictors 0.85 0.80 0.75 0.70 Index I 0.65 0.60 Euc. 0.55 Mah. 0.50 MSN 0.45 RF Best Performing Slide Number 32 of 31 Worst Performing
kNN: Responses 0.85 0.80 0.75 Index I 0.70 0.65 MSN 0.60 RF 0.55 Worst Performing Best Performing Slide Number 33 of 31
kNN: Stratification 0.8 0.7 Index I 0.6 0.5 un- stratified stratified 0.4 0.3 Large n Small n Slide Number 34 of 31
Conclusion - Revisited kNN diameter density estimation with LiDAR is comparable with or superior (precision) to a Post- stratified approach with variable radius plots Equivalent: Stratum, Tract Superior: Plot, Stand Mahalanobis with k=3, lidar P30 and P90 metrics worked well Stratification did not help may be due to sample size (~200) Slide Number 35 of 31
Thank you! Any questions? Comments? Suggestions? I am planning to submit a manuscript in December Slide Number 36 of 31


")