Learn about property taxes in Montana used to fund various services at state and local levels, including schools, special districts, and Tax Increment Financing (TIF). Explore a master property tax model created by legislative staff for detailed analysis and scenarios. View statewide tax data breakdowns and interactive tools for better insight.
Please find below an Image/Link to download the presentation.
The content on the website is provided AS IS for your information and personal use only. It may not be sold, licensed, or shared on other websites without obtaining consent from the author. If you encounter any issues during the download, it is possible that the publisher has removed the file from their server.
You are allowed to download the files provided on this website for personal or commercial use, subject to the condition that they are used lawfully. All files are the property of their respective owners.
The content on the website is provided AS IS for your information and personal use only. It may not be sold, licensed, or shared on other websites without obtaining consent from the author.
E N D
Presentation Transcript
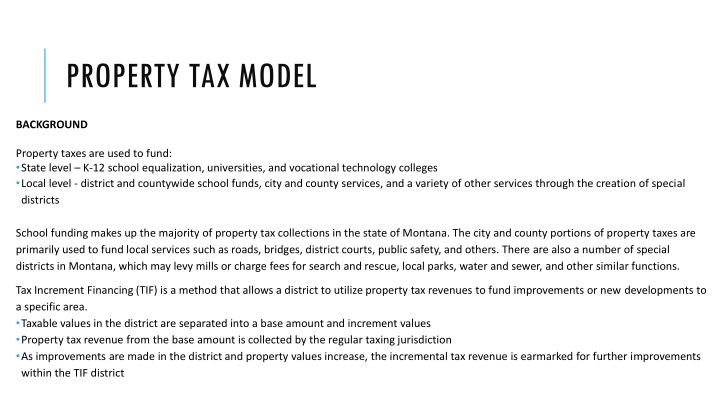
PROPERTY TAX MODEL BACKGROUND Property taxes are used to fund: State level K-12 school equalization, universities, and vocational technology colleges Local level - district and countywide school funds, city and county services, and a variety of other services through the creation of special districts School funding makes up the majority of property tax collections in the state of Montana. The city and county portions of property taxes are primarily used to fund local services such as roads, bridges, district courts, public safety, and others. There are also a number of special districts in Montana, which may levy mills or charge fees for search and rescue, local parks, water and sewer, and other similar functions. Tax Increment Financing (TIF) is a method that allows a district to utilize property tax revenues to fund improvements or new developments to a specific area. Taxable values in the district are separated into a base amount and increment values Property tax revenue from the base amount is collected by the regular taxing jurisdiction As improvements are made in the district and property values increase, the incremental tax revenue is earmarked for further improvements within the TIF district
PROPERTY TAX MODEL THE MODEL Legislative staff created a master property tax model to better understand locally paid taxes and where the growth in property taxes has come from in the past. The model can also help to answer questions in greater detail and model certain proposed scenarios. This model is the result of new work on splitting out the amount of new tax burden from new property versus existing property Data was compiled from the following sources: Department of Revenue property tax data base data, special district data, Tax Increment Financing (TIF) district data, and newly taxable property data Office of Public Instruction school budget and expenditure data Department of Administration local government ledger This presentation includes select screen shots to illustrate key points, but the interactive model tool can be found here: https://leg.mt.gov/lfd/mara-data-project/. The interactive tool can show similar breakdowns from statewide down to the local municipality. DISCLAIMER Due to the nature of these data, there are many calculated fields in this dashboard. If you have questions or concerns, please contact the Legislative Fiscal Division.
Statewide Format of Graphics and Data All this data is taxes paid It includes all levied taxes, including the state mills and those for schools, counties, cities, etc. It does not include SIDs and fees which are not based on levies (about $170M)
Statewide Format of Graphics and Data These data can be viewed by taxing unit, by a specific county, or even by a specific municipality
Statewide Format of Graphics and Data The first graphic is the taxes paid by taxing unit (state, city, county, county- wide education, school district, and other) from FY 2016 through FY 2022 The second chart shows the annual growth in taxes paid. When a slicer option is selected, this chart will also show the annual growth for the selection compared to the statewide growth you see here
Statewide Format of Graphics and Data The charts to the right show the compound annual growth rate (CAGR) for the time period between FY 2016 and FY 2022, both by taxing unit and by property class (residential vs. other) The third graphic shows the taxes paid for residential property versus the taxes paid for all other types of property combined
Statewide Format of Graphics and Data In FY 2018, property taxes paid to school districts increased by a large amount, which was a combination of the elimination of the distribution of general fund block grants to school districts (HB 647, 2017 Legislative Session) and the anticipated growth for school construction projects Growth in property taxes paid alternates between years of large growth and years of smaller growth due to the residential property two-year reappraisal cycle
Statewide Format of Graphics and Data Taxes paid for residential property are increasing faster that taxes paid on all other types of property
Statewide Format of Graphics and Data The first graphic is the additional taxes paid in the given fiscal year broken between existing property, new property, and TIFs o This is cumulative so it grows on top of the previous year s growth o FY 2018 had a bump from adjustments to block grants to school districts and the anticipated growth for school construction projects The second chart shows that in context with all levied taxes
Statewide Format of Graphics and Data The CAGRs for each group of property are shown here These data can be viewed by the same breakdown as the previous page data (by taxing unit, by a specific county, or even by a specific municipality)
Statewide Format of Graphics and Data Same data as shown above, split into existing property by taxing unit (state, city, county, school district, etc.) Same data as shown above, split into new property by taxing unit (state, city, county, school district, etc.)
Statewide Format of Graphics and Data Growth in existing property is largely a function of decisions made by the entities collecting the taxes, while the growth in new property and TIFs is distributed proportionally between taxing unit FY 2018 is a good example of this phenomenon o New taxes paid on existing property adjusted to budgets/needs for schools o Taxes paid on new property came onto the tax rolls proportional to the current demand for all services
Example High Growth County Gallatin When Gallatin County is selected under County, the Municipality option is filtered down to all the municipalities within Gallatin County
Example High Growth County Gallatin The growth by tax class is not even. Residential property taxes are growing at a faster rate than all other classes Since the slicer option is selected for Gallatin County, the annual growth in taxes paid for Gallatin County is shown here as compared to the statewide growth
Example High Growth County Gallatin As an example of existing property taxes adjusting to budgets/needs is in FY 2019 when various school infrastructure votes hit in Gallatin County o The increase in school funding can be seen here not having the reappraisal tick-tock
Example Low Growth County Mineral There are counties where existing property pays less property tax now than 6 years ago, but this shift is not uncommon as higher residential value growth causes shifts in the tax burden
Example Low Growth County Mineral There are counties where existing property pays less property tax now than 6 years ago, but this shift is not uncommon as higher residential value growth causes shifts in the tax burden o This lower tax amount is in total; residential property taxes are still growing in Mineral County. The decrease will be attributable to other classes (in this case, pipelines/electrical utilities and business equipment)
New vs. Existing Offset - Hill County There are many cases where taxes paid by new property are high enough that it buys down property taxes on existing property, especially in non-reappraisal years
New vs. Existing Offset Hill County Another example of existing property taxes adjusting to budgets/needs (versus new property coming onto the tax rolls more proportionately) o Because of the way taxes on new property are attributed to cities and counties, as opposed to schools which have capped budgets, the most common offset occurs at the county-wide education and local school mills
New vs. Existing Offset Dawson County The annual taxes paid to the state from existing property can be negative if there is a net value reduction Local governments (cities and towns in this case) can also choose to offset existing property taxes with taxes from new property. This is not required but it does occur


![Town of [Town Name] Real Estate Tax Rates and FY 2024 Budget Summary](/thumb/62211/town-of-town-name-real-estate-tax-rates-and-fy-2024-budget-summary.jpg)