Proportionate Expenditure Performance Analysis 2021 vs 2020
Extracted from detailed revenue and expenditure breakdowns, this report analyzes the proportionate performance of budget allocations in 2021 versus 2020. Key areas such as revenue sources, funding proportions, and expenditure categories are highlighted to provide insights into financial management. Visual representations aid in understanding performance metrics for informed decision-making.

Download Presentation

Please find below an Image/Link to download the presentation.
The content on the website is provided AS IS for your information and personal use only. It may not be sold, licensed, or shared on other websites without obtaining consent from the author. If you encounter any issues during the download, it is possible that the publisher has removed the file from their server.
You are allowed to download the files provided on this website for personal or commercial use, subject to the condition that they are used lawfully. All files are the property of their respective owners.
The content on the website is provided AS IS for your information and personal use only. It may not be sold, licensed, or shared on other websites without obtaining consent from the author.
E N D
Presentation Transcript
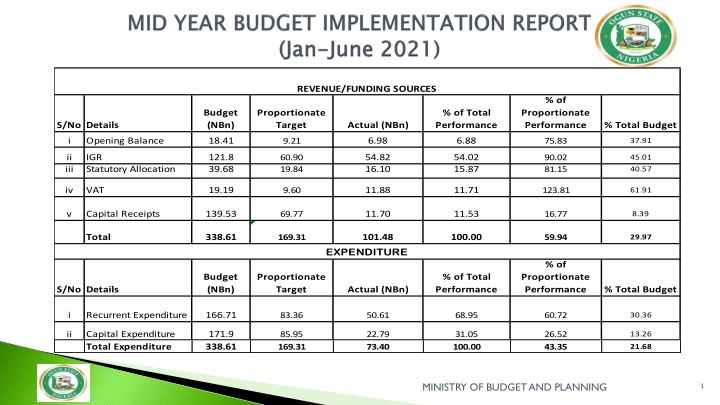
REVENUE/FUNDING SOURCES % of Budget (NBn) Proportionate Target % of Total Performance Proportionate Performance Actual (NBn) % Total Budget S/No Details i Opening Balance 18.41 6.98 6.88 9.21 75.83 37.91 ii iii IGR Statutory Allocation 121.8 39.68 54.82 16.10 54.02 15.87 60.90 19.84 90.02 81.15 45.01 40.57 iv VAT 19.19 11.88 11.71 9.60 123.81 61.91 v Capital Receipts 139.53 11.70 11.53 69.77 16.77 8.39 Total 338.61 101.48 100.00 169.31 59.94 29.97 EXPENDITURE % of Budget (NBn) Proportionate Target % of Total Performance Proportionate Performance S/No Details Actual (NBn) % Total Budget i Recurrent Expenditure 166.71 83.36 50.61 68.95 60.72 30.36 ii Capital Expenditure Total Expenditure 171.9 338.61 85.95 169.31 22.79 73.40 31.05 100.00 26.52 43.35 13.26 21.68 MINISTRY OF BUDGET AND PLANNING 1
Proportionate Expenditure Performance 2021 vs 2020 Expenditure Performance as at June, 180 2021 stood at N N73 73. .40 40B B which represents 160 43 43. .36 36% % of of the the proportionate proportionate target target of of 140 N N169 169. .31 31B B. . 120 It also represents 21 21. .68 68% % of of the the total 100 budget of N N338 338. .61 61B B. 80 The performance depicts a positive 60 change of 14 14. .13 13% % in in expenditure expenditure when 40 compared with the actual expenditure for 20 the corresponding period of 2020, which was N N64 64. .31 31B B representing 22 22. .89 89% % of the 0 2021 2020 total Revised Budget of N N280 280. .91 91B B and and Proportionate Budget 45 45. .78 78% % of the proportionate budget of Actual Performance N N140 140. .45 45B B. . MINISTRY OF BUDGET AND PLANNING 2
MINISTRY MINISTRYOF BUDGET AND PLANNING OF BUDGET AND PLANNING 3
% OF TOTAL % OF TOTAL S/No S/No Details Details Actuals N(Bn) Actuals N(Bn) % of Total % of Total OPENING BALANCE, 6.98% OPENING BALANCE, 6.98% CAPITAL RECEIPT, , 11.32% 11.32% i Opening Balance 6.98 6.88 ii IGR 54.82 54.02 iii Statutory Allocation 16.1 15.87 STATUTORY ALLOCATION, 15.58%, IGR, 53.04%, Value Added Tax 11.88 11.71 iv Total Revenue Total Revenue 89.78 89.78 88.47 VAT, 11.49%, v Capital Receipt 11.7 11.53 Total Funding Sources Total Funding Sources 101.48 101.48 100.00 MINISTRY OF BUDGET AND PLANNING 4
2021 2020 Jan. Jan.- -June June Actual Actual (N bn) (N bn) % of % of % of % of 2021 2021 Estimates Estimates Proportionate Proportionate Target Target Proportionate Proportionate Performance Performance 2020 Revised 2020 Revised Estimates Estimates Proportionate Proportionate Target Target Jan. Jan.- -June June Actual ( Actual (Nbn Proportionate Proportionate Performance Performance S/NO. S/NO. Details Details Nbn) ) i ii (a) Opening Balance Opening Balance (IGR) Ministries Boards and Corporations Total IGR Total IGR Statutory Allocation VAT Total Revenue Total Revenue Capital Receipts 18.41 18.41 9.21 9.21 6.98 6.98 75.83 75.83 10.66 10.66 0 21.31 48.71 84.20 51.41 97.41 41.01 102.82 17.71 34.45 (b) iii iv v TOTAL TOTAL 12.20 60.91 19.84 9.60 99.55 69.76 169.31 113.20 90.01 81.15 123.81 83.18 16.77 59.94 5.37 56.78 11.85 7.05 75.67 54.13 140.46 24.4 13.81 54.82 16.10 11.88 82.8 11.70 101.48 10.73 113.55 23.69 14.10 151.34 108.26 280.91 5.97 23.68 17.23 6.75 47.66 2.83 50.49 111.28 41.71 145.46 95.74 62.98 5.23 35.95 121.81 39.68 19.19 199.09 139.52 338.61 Actual Performance 2021 2020 60 40 20 0 Opening Bal. IGR Statutory Allocation VAT Capital Receipts MINISTRY OF BUDGET AND PLANNING 5
REVENUE/FUNDING SOURCES % Budget (NBn) 21.31 Proportionate Target 10.66 % Performance on Total Budget 0 Proportionate Performance 0 % Total Performance 0 S/No Details i Opening Balance Actual (NBn) 0 ii iii Statutory Allocation iv VAT v Capital Receipts IGR 113.55 56.78 11.85 7.05 54.13 23.68 17.23 6.75 2.83 50.49 20.85 72.73 47.87 2.61 41.71 145.46 95.74 5.23 46.90 34.13 13.37 5.61 23.69 14.1 108.26 Total 280.91 140.46 17.97 35.95 100.00 6 MINISTRY OF BUDGET AND PLANNING
% APPROVED PROVISION N(BN) ACTUAL PERFORMANCE N(BN) % PROPORTIONATE PERFORMANCE PERFORMANCEON TOTAL BUDGET S/N AGENCIES PROPORTIONATE TARGET 1 Board of Internal Revenue 75,000,000,000.00 37,500,000,000.00 17,936,089,263.45 47.83 23.91 2 3 Bureau of Lands and Survey OPIC 10,000,000,000.00 5,000,000,000.00 5,000,000,000.00 2,500,000,000.00 3,760,475,389.19 1,330,069,040.60 75.21 53.20 37.60 26.60 4 5 Ogun State Permit Authority Ministry of Education Ministry of Industry, Trade and Investment 4,133,110,000.00 1,145,640,000.00 2,066,555,000.00 572,820,000.00 1,141,946,658.02 787,611,795.88 55.26 137.50 27.63 68.75 6 1,225,000,000.00 612,500,000.00 258,373,587.77 42.18 21.09 Agricutural Development Corporation 7 315,836,220.20 157,918,110.10 311,247,798.13 197.09 98.55 8 9 10 Ministry of Physical Planning Ministry of Agriculture Ministry of Forestry 492,000,000.00 212,162,504.25 350,000,000.00 246,000,000.00 106,081,252.13 175,000,000.00 185,523,175.75 158,737,009.75 147,714,121.43 75.42 149.64 84.41 37.71 74.82 42.20 11 Agro Services Corporation 65,816,900.00 32,908,450.00 21,259,310.00 64.60 32.30 12 Ogun State Water Corporation Ministry of Works and Infrastructure Sub-Total Others TOTAL 100,000,000.00 50,000,000.00 5,018,245.00 10.04 5.02 13 90,978,815.05 98,130,544,439.50 23,676,332,336.13 121,806,876,775.63 45,489,407.53 49,065,272,219.75 11,838,166,168.07 60,903,438,387.82 12,264,715.00 26,056,330,109.97 28,767,124,244.06 54,823,454,354.03 26.96 53.11 243.00 90.02 13.48 26.55 121.50 45.01 MINISTRY OF BUDGET AND PLANNING 7
MINISTRY MINISTRYOF BUDGET AND PLANNING OF BUDGET AND PLANNING 8
Actual Expenditure Jan. June 2021 N(Bn) % Performance on Budget % Proportionate Expenditure % of Total Actual Expenditure Details Approved Budget N(Bn) Proportionate Target Salaries & Allowances 72,760,161,564.51 36,380,080,782.26 28,976,278,819.93 39.82 79.65 39.48 Consolidated Revenue Fund Charges 20,182,910,593.04 10,091,455,296.52 6,367,707,412.65 31.55 63.10 8.67 Total Personnel Cost Overhead Cost 92,943,072,157.55 54,933,731,418.87 46,471,536,078.78 27,466,865,709.44 35,343,986,232.58 10,623,660,449.51 38.03 19.34 76.06 38.68 48.15 14.47 Public Debt Charges (Overhead ) 18,836,000,718.71 9,418,000,359.36 4,637,434,004.20 24.62 49.24 6.32 Total Recurrent Expenditure Capital Expenditure 166,712,804,295.13 162,363,053,140.91 83,356,402,147.57 81,181,526,570.46 50,605,080,686.29 17,539,589,719.17 30.35 10.80 60.71 21.61 68.94 23.89 Public Debt Charges (Capital) 9,535,085,585.82 4,767,542,792.91 5,258,652,771.94 55.15 110.30 7.16 Total Capital Expenditure Total Expenditure 171,898,138,726.73 338,610,943,021.86 85,949,069,363.37 169,305,471,510.93 22,798,242,491.11 73,403,323,177.40 13.26 21.68 26.53 43.36 31.06 100.00 MINISTRY OF BUDGET AND PLANNING 9
Actual Expenditure Jan. June 2020 N(Bn) % Performance on Approved Budget % of Actual Expenditure on Total Expenditure Details Approved Budget N(Bn) Salaries & Allowances 69,087,567,259.23 25,970,171,788.61 37.59 40.39 Consolidated Revenue Fund Charges 15,566,772,510.19 8,446,114,450.09 54.26 13.13 Total Personnel Cost 84,654,339,769.42 34,416,286,238.70 40.66 53.52 Overhead Cost 39,148,659,349.35 10,120,697,027.06 25.85 15.74 Public Debt Charges (Overhead ) Total Recurrent Expenditure 8,678,052,005.76 335,331,836.02 3.86 0.52 132,481,051,124.53 44,872,315,101.78 33.87 69.78 Capital Expenditure Public Debt Charges (Capital) Total Capital Expenditure 141,426,487,251.94 14,895,888,809.84 10.53 23.16 7,000,000,000.00 4,537,547,197.27 64.82 7.06 148,426,487,251.94 19,433,436,007.11 13.09 30.22 Total Expenditure 280,907,538,376.47 64,305,751,108.89 22.89 100.00 MINISTRY OF BUDGET AND PLANNING 10
2021 2021 2020 2020 Actual Actual Performance Performance N( N(Bn Bn) ) Actual Actual Performance Performance N( N(Bn Bn) ) % % of of Total Total % Change % Change S/N S/N Details Details % % of Total of Total Salaries and Allowances 11.59 24.62 2.70 4.94 1306.06 11.59 - -24.62 2.70 4.94 1306.06 i 28.98 39.48 25.97 40.39 ii CRFC 6.37 8.68 8.45 13.14 Total Personnel Cost Total Personnel Cost 35.35 35.35 48.16 48.16 34.42 34.42 53.53 53.53 iii Overhead Cost 10.62 14.47 10.12 15.74 iv Public Debt Charges Total Recurrent Total Recurrent Expenditure Expenditure 4.64 6.32 0.33 0.51 12.79 17.29 14.15 12.79 17.29 14.15 50.61 50.61 68.95 68.95 44.87 44.87 69.78 69.78 v Capital Expenditure 22.79 31.05 19.43 30.22 Total Expenditure Total Expenditure 73.40 73.40 100.00 100.00 64.30 64.30 100.00 100.00 Actual Expenditure Performance 40 20 0 Salaries & Allowances CRFC Overhead Cost PDC Capital 2021 2020 MINISTRY OF BUDGET AND PLANNING 11