Public education spending and poverty in Burkina Faso: A CGE approach
With Burkina Faso facing high poverty rates despite average GDP growth, this study delves into the impact of increasing public spending on education to reduce poverty. By analyzing resource allocation to primary education through different financing mechanisms, the study aims to shed light on potential welfare improvements.

Download Presentation

Please find below an Image/Link to download the presentation.
The content on the website is provided AS IS for your information and personal use only. It may not be sold, licensed, or shared on other websites without obtaining consent from the author.If you encounter any issues during the download, it is possible that the publisher has removed the file from their server.
You are allowed to download the files provided on this website for personal or commercial use, subject to the condition that they are used lawfully. All files are the property of their respective owners.
The content on the website is provided AS IS for your information and personal use only. It may not be sold, licensed, or shared on other websites without obtaining consent from the author.
E N D
Presentation Transcript
Public education spending and poverty in Burkina Faso: A CGE approach Presented by: Lacina BALMA Prepared for African Economic Conference Addis Ababa, October 26-28, 2011 1
Background/Rational With an average GDP growth of 5.1% over the last 10 years, BF remains one of the poorest countries and has consistently scored very low on all social indicators, with a national poverty rate of 43,9% in 2010. The government in power over more than 20 years has renewed its commitment toward reducing poverty through its 2010 Strategy for Faster growth and Sustainable Development and expects to reach double digit GDP growth over the next five years. An important pillar of its new development plan is to increase access to basic services, in particular by deepening the human resource base as a means of promoting sustainable growth. 2
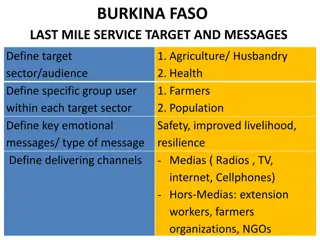
Background/Rational (cont.) Poverty-reducing outlay reached an average of 24% over 2007-09, up from 22% in 2001-06 Poverty-Reducing Expenditure (In Billion of CFAF) 300 250 200 Education was given an important share and amounted for more than 40% of the total social spending over the last 10 years 150 100 50 0 2005 2006 2007 2008 2009 In line with its new poverty reduction strategy, the government launched a ten-year development plan for education in 2010 aiming to increase school enrollment rate an improve the efficiency and the quality of education. 50.0 %Total Poverty-Reducing Social Expenditure 40.0 30.0 Rational: in light of this background, testing empirically an increase in public spending in education in a context of constrained fiscal space could stimulate policy debate. 20.0 Health Education 10.0 Others 0.0 2000 2002 2004 2006 2008 2010
Objectives Main objective analyze the effect of allocating additional resource to education on welfare and poverty Specifically 40%-increase of resource allocated to primary education sector through two alternative domestic financing mechanisms: (1) raising sale tax; (2) raising income tax. 4
Methodology Total spending (private and public) per student in primary education Private. unit cost of Prim. Educ Pub. unit cost of Prim. Educ = + , h edb , h edb TEDh CEDT Gov. Expenditure in primary education Total volume of students q h * TED s LS = Gedb h h h Gov. budget constraint = transfers SG YG Pc G Pc G Pc G eds ser edb edb eds ser Compensating Variables: sale tax and income tax 5
Methodology (Cont.) Household labour income maximization Private spending on Prim. Educ Labor income q h q h q h + = (1 ) (1 ) * * W LS W s LS Pc s LS Max YH , nq h q h h edb edb h q h h + CET function - non labor income Pc ED , h eds eds 1 l l l k k l k l q h l q h + = Net gain of education [ ] (1 )[(1 ) ] LS LS . . s t LS B h h h h h h Resulting demand function l l W W sW W s Pc q h q q , W h edb edb l l (1 ) = h h q h 1 nq nq nq 6 opportunity cost skills premium direct cost
Simulation and Results 40%-increase in Pub. Unit Cost of Prim. Educ. Government Household Supply of education (govt.) Private Cost (direct effect) Expenditures Net Gain Taxes (income, sale) Demand for education (household) Factors Market : Qualified Salary Unqualified Salary Factors endowment (supply): Qualified labor Unqualified labor Gross Income Consumption prices 7
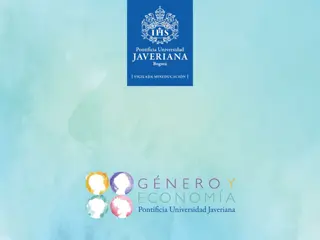
Simulation and Results Decline in the number of poor in the country (-0.42%). Impact on poverty (40%-increase in Prim. Educ. Spending by Gov. compensate with 7.2% income tax increase The poverty rate among both households informally working in the private sector and cotton farmers remains unchanged, while all other household categories experience a decline in poverty. All % Poverty rate Independent and inactive % Consumer Price Index Livestock farmers Income Subsistence farmers The second scenario (same govt. spending compensate with 2% sale tax increase leads to a lesser decrease in the number of poor across the economy (-0.33%), a decrease that also varies by socio- professional category. Cotton farmers Private informal workers Public and private formal workers -1.0 -0.5 0.0 0.5 1.0 1.5
Policy implication This study shows that a public education spending policy in Burkina Faso would have substantial and differentiated impacts which benefit the poor and non-poor alike. It also highlights that the method of financing an additional spending policy in the education sector conditions the impact of the policy. According to the simulation results, financing the policy through a tax on household incomes would have greater redistributive effects a greater decrease in the number of poor households than if it is financed by a sale tax. This finding shows that the government must choose wisely when considering policies to domestically finance education policy. 9
Way forward Endogenize the level of secondary and post- secondary education in a dynamic model Further segmentation in the labour market : unqualified labour, primary qualified, secondary qualified and post-secondary qualified. Allow households to make more complex decisions by allowing them to select the level of education they wish to attain through investments in education. 10


")


")