Public Expenditure Review of STI Policies - Regional Innovation Forum
The Public Expenditure Review discusses the paradox and dilemma of innovation policies, emphasizing the importance of assessing government resource allocation for Science, Technology, and Innovation (STI). It delves into the motivations, objectives, methodology, and stages of analysis for enhancing STI outcomes and policy quality.
Download Presentation

Please find below an Image/Link to download the presentation.
The content on the website is provided AS IS for your information and personal use only. It may not be sold, licensed, or shared on other websites without obtaining consent from the author.If you encounter any issues during the download, it is possible that the publisher has removed the file from their server.
You are allowed to download the files provided on this website for personal or commercial use, subject to the condition that they are used lawfully. All files are the property of their respective owners.
The content on the website is provided AS IS for your information and personal use only. It may not be sold, licensed, or shared on other websites without obtaining consent from the author.
E N D
Presentation Transcript
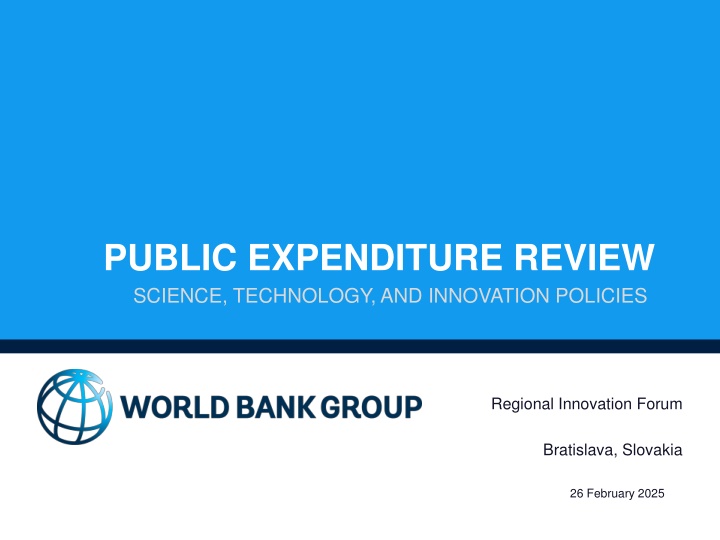
PUBLIC EXPENDITURE REVIEW SCIENCE, TECHNOLOGY, AND INNOVATION POLICIES Regional Innovation Forum Bratislava, Slovakia 26 February 2025
INNOVATION PARADOX AND INNOVATION POLICY DILEMMA The innovation policy paradox: The further away from the technological frontier the higher the dimensionality of issues to be addressed The innovation policy dilemma The further away from the technological frontier the weaker state capability for implementation 1 Public Expenditure Review of Science, Technology, and Innovation (STI) policies
THE CAPABILITIES ESCALATOR 2 Public Expenditure Review of Science, Technology, and Innovation (STI) policies
PUBLIC EXPENDITURE REVIEWS FOR STI Motivation Objectives Increasing evidence that National Systems of Innovation are fragmented, uncoordinated and with little evidence of impact To assesswhether government s allocation of resources has an impact on STI outcomes through the quality and coherence of the policy mix; the quality of design, implementation and governance; its efficiency and its impact. Existing analysis and evaluations tend to be either too aggregated and institutional or too narrow focusing one program or instrument To help countries improve their capacity and quality of their STI policies. This includes building governments capacity to design, implement and monitor STI policies and to rationalize their policy mix measure, learn and adapt. Can we respond to basic questions with greater certainty? How much is spent? For what? What is the quality and coherence of the policy mix? How efficient is this investment? With what results? 3 Public Expenditure Review of Science, Technology, and Innovation (STI) policies
METHODOLOGY Logical framework of an STI intervention (Correa, 2014) 4 Public Expenditure Review of Science, Technology, and Innovation (STI) policies
Four stages of the PER analysis Effectiveness analysis Efficiency analysis Impact of STI policies on Innovation and technology adoption Functional and governance analysis Amount transferred to beneficiaries for every US$ 1 spent on the administration of the program. Portolio mapping and analysis of the quality of the policy mix 5 Public Expenditure Review of Science, Technology, and Innovation (STI) policies
DIFFERENCES WITH TRADITIONAL PER Traditional PER Aggregate expenditure by investment project STI PER Unit of analysis Program or instrument Efficiency and financial analysis No attribution to impact Difficult to implement in STI given heterogeneity of programs Focus on efficiency and impact Emphasis on the quality of the policy mix and how it responds to the demand for innovation Emphasis on the quality of design, implementation and governance of the programs based on international best practices. Approach Rationalization of the policy mix and identification of gaps in public support Improvements in the quality of design, implementation and governance of the system Budgetary changes Benchmarking of expenditure Use 6 Public Expenditure Review of Science, Technology, and Innovation (STI) policies
What is the value added of this expenditure review? Public Expenditure Reviews (PER) would provide an analytical framework that opens the black box and analyzes public expenditure on R&I in detail to establish whether the results of these investments are effective (reached desirable outcomes) and efficient (at minimum costs). And in doing so creates information that addresses coordination issues inherent to the policymaking process. R&D Budget How does a PER add value? Other reports do not provide a systematic framework to track public expenditures in R&I and measure its impact. -The most comprehensive review of innovation policies are conducted by OECD but they do not provide detailed disaggregated data on public spending and its effect on the innovation spending -The PER offers a systematic framework to organize public spending and track its impact on different aspects of the innovation system 7
APPLICATIONS AND EXAMPLES 8 Public Expenditure Review of Science, Technology, and Innovation (STI) policies
UNINTENDED CONSEQUENCES CASE OF TURKEY An effort to foster collaboration between science and industry Tax breaks policies established the location at science parks as a condition -- fostering the demand for space in science parks (infrastructure space in universities). Subsidies supported the expansion of science parks . Result : by 2009 Turkey had about 12.3 parks/ 1 billion of R&D (vs 3.2 in US and 2.9 in Canada) - 7.3 parks/10.000 researchers (vs 1.2 in US and 1.9 in Canada) virtually no collaboration (only 4 firms out of all firms located in the parks) CASE OF ROMANIA An effort to increase public R&D expenditures to improve economic performance Reaching the 3 percent target would increase exports by 13,5 percent and GDP by 11,7 percent by 2025 (results from World Scan Model). Between 2004-08, Romania s Government duplicated their R&D effort (0.5-1.1) as a share of GDP. In the same period, share of basic research increased from 22 to 40% of total investments. The US was investing 17% and Israel and Japan less than 15%. 9 Public Expenditure Review of Science, Technology, and Innovation (STI) policies
MAPPING POLICY GOALS TO OUTCOMES 10 Public Expenditure Review of Science, Technology, and Innovation (STI) policies
BREAKING DOWN THE INNOVATION POLICY BLACK BOX Governments often decide on inputs with the implicit idea that they will generate a certain output without considering the necessary and sufficient conditions or the chain of events that will lead to the desired output Process of backward induction - Define desired outcome -Identify intermediate objectives - Identify the chain of events from public investments to intermediate objectives (outputs) Logical Framework: Inputs Outcomes Outputs?? Defined Objectives (Outcomes) Public Funds Box Black Chain of Events Necessary and sufficient conditions 11
MAPPING POLICY GOALS TO OUTCOMES Mismatch of budget allocation with the national development objectives Budget by objective 2010-2014 1400 Mejoramiento prod. Negocios existentes Productive improvement of existing businesses Invest. Insumo para innov. Diversification through new business dev. Investment inputs for innovation 1200 12% Dllo. Nuevos negocios diversif. Prod. 12% 1000 Miles de millones 39% 10% 33% 800 19% 23% 600 74% 400 69% 48% 50% 55% 200 29% 16% 13% 0 2010 2011 2012 2013 2014 12 Public Expenditure Review of Science, Technology, and Innovation (STI) policies
THE STI POLICY MIX High concentration of direct support using matching grants High budget concentration in a few instruments 80 % 70 100 Concentration: 12 instruments 75% budget 90 60 80 70 40 60 50 40 21 20 30 12 8 7 6 6 5 20 3 3 001000002 2002 00000020 0 00000100100100 0 00001 110000 0 0000 0 0 10 BANCOLDEX COLCIENCIAS INNPULSA MADR MINCIT MINTIC PTP SENA - exencion impositiva subsidios 1 2 3 5 7 12 20 28 43 65 133 financiacion vouchers Numero de programas compras publicas premios becas servicios y bienes 13 Public Expenditure Review of Science, Technology, and Innovation (STI) policies
FUNCTIONAL ANALYSIS The objective of this part is to evaluate the quality of design, implementation and governance of STI programs across three dimensions - 31 categories Origin Learning IMPLEMENTATION DESIGN GOVERNANCE Relationship between instruments Justification Calls Objectives Elegibility and selection Relationship between institutions Logical framework Application process Relationship with Policy Mix Information management Relationship with other policy frameworks - limitants Inputs Finalizing and follow up Activities Products Budget adequacy Relationship with other policy frameworks - responses Beneficiariies Organization Audiences - Autonomy Results and impact - Incentives Elegibility and selection - Monitoring Staff adequacy Choice of instrument M&E and IE M&E 14 Public Expenditure Review of Science, Technology, and Innovation (STI) policies
15 IV. FUNCTIONAL ANALYSIS The Good Practice Model Market failure is identified and justifies design and intervention Clearly identified objectives that are measurable Program origin is not ad hoc Explicit and realistic logical framework Enough human, financial and organizational resources. Good managerial practices. Use of M&E framework, with good indicators and good measurement. Consideration of use of impact evaluation Evidence based choice of instrument and consideration of costs and alternatives Appropriate selection of beneficiaries Formal system to adopt lessons and learning to make program more efficient 15
FUNCTIONAL ANALYSIS Governance origin govenr_cond justification govern_cap policymix govern_inst objectives govern_prog logical m&e2 inputs Design monitoring activities incentives products staff beneficiaries 2 autonomy stakeholders organization instrument 3 budget results 4 final eligibility information_man m&e 5 application learning eligibility2 calls Implementation 16 Public Expenditure Review of Science, Technology, and Innovation (STI) policies
KEY QUESTIONS OF THE EFFICIENCY PHASE Cost structure What is the composition of administrative costs? How much is spent in administrative costs per project? What is the ratio of the administrative costs to the value of benefits transferred? How do the administrative costs compare across programs? Is it possible to reduce administrative costs without affecting the quality of program management? Is it possible to reduce transaction (monetary and nonmonetary) costs for applicants? Input-Output What is the value of program benefits per project? How are the benefits distributed across beneficiaries? What is the value of the results generated by the program (per program, per beneficiary, per each dollar spent)? Are the outputs consistent with resources allocated to the program? Are the program benefits commensurate with the application / administration costs? Could funding amounts be reduced without comprising the current performance? Could higher output levels be achieved with the existing funding level? 18 Public Expenditure Review of Science, Technology, and Innovation (STI) policies
INPUTS COMPOSITION: ADMIN COSTS VS IMPLEMENTATION COSTS Technology extension R&D tax credits 0.6% 17.8% 27.5% 72.5% 1.7% 98.3% 0.6% 9.3% 0.4% Direct and indirect funding Direct & indirect funding, and technical assistance Staff (management and supervision) Implementation and monitoring Design, materials and infrastructure Call for proposals, application and selection Call for proposals, application and selection Design, materials and infrastructure Implementation, monitoring and training Staff (management and supervision) 21 Public Expenditure Review of Science, Technology, and Innovation (STI) policies
BENEFICIARY TRANSFERS PER PROJECT 70 59.0 60 50 40 30 22.1 20 10 5.6 5.5 2.2 0 R&D tax credits PhD Incubators Early stage financing Technology extension scholarships 22 Public Expenditure Review of Science, Technology, and Innovation (STI) policies
BENEFICIARY FEEDBACK Beneficiaries perception towards the program outcomes Beneficiaries satisfaction with the program s performance on each stage (Percentage of affirmative responses) (Percentage of affirmative responses) Implemented new process or technology 63.6% Application costs are consistent with the benefits produced 88.9% Increased productivity 58.2% Commercialized project results 38.2% The time available contributes to the fulfillment of the objectives 87.3% Increased number of workers 32.7% Reduced production costs 32.5% The program's support contributes to the fulfillment of its objectives 74.5% Improved exports performance 26.8% 24 Public Expenditure Review of Science, Technology, and Innovation (STI) policies
MONITORING VS EVALUATING Evaluating Ex post evaluation of the results to: Confirm or not the hypothesis of the results chain Establish causality Database to cost effectiveness (costs/benefits balance for a given program) Monitoring Collecting data to: Improve day-to-day management and decisions Track program performance against expected results Measure costs/efficiency (unitary cost per product) Does the intervention reach the objectives in an efficient manner? Does it so accordingly with the original plans? Is the intervention effective? What would have happened in the absence of the intervention? 25 Public Expenditure Review of Science, Technology, and Innovation (STI) policies
THANKS FOR YOUR ATTENTION DENIS MEDVEDEV LEAD ECONOMIST DMEDVEDEV@WORLDBANK.ORG LEONARDO IACOVONE LEAD ECONOMIST LIACOVONE@WORLDBANK.ORG Regional Innovation Forum FIRM CAPABILITIES AND INNOVATION GLOBAL UNIT Bratislava, Slovakia 26 February 2025 26
