Public Opinion on Single-Payer Health Plans and Medicare Coverage Expansion Trends
Explore public opinion trends on single-payer health plans, national health coverage, and expanding access to Medicare through insightful poll findings from KFF Health Tracking Polls. Discover shifting viewpoints towards federal government involvement, support for a national health plan, and perceptions of a Medicare-for-all system, highlighting partisan divisions over time.

Download Presentation

Please find below an Image/Link to download the presentation.
The content on the website is provided AS IS for your information and personal use only. It may not be sold, licensed, or shared on other websites without obtaining consent from the author. If you encounter any issues during the download, it is possible that the publisher has removed the file from their server.
You are allowed to download the files provided on this website for personal or commercial use, subject to the condition that they are used lawfully. All files are the property of their respective owners.
The content on the website is provided AS IS for your information and personal use only. It may not be sold, licensed, or shared on other websites without obtaining consent from the author.
E N D
Presentation Transcript
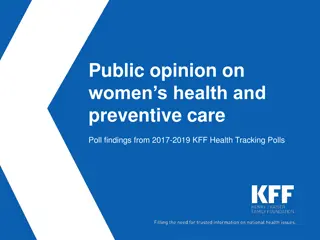
Public Opinion on Single-Payer, National Health Plans, and Expanding Access to Medicare Coverage Poll findings KFF Health Tracking Polls
Figure 1 Most Support Federal Government Doing More To Help Provide Health Insurance, But Republican Support Has Declined Over Time Percent who say they favor the federal government doing more to help provide health insurance for more Americans: November 2006 September 2008 January 2019 85% Total 75% 74% 96% Democrats 92% 94% 86% Independents 73% 77% 72% Republicans 49% 40% SOURCE: KFF Polls. See toplines for full question wording and response options.
Figure 2 A National Health Plan Didn t Garner Majority Support Until 2016 Percent who favor or oppose a national health plan in which all Americans would get their insurance from a single government plan: Favor Oppose 100% 90% 80% 43% 49% 70% 53% 55% 60% 50% 40% 30% 50% 46% 40% 39% 20% 10% 0% 1998-2000 (avg of 6 polls) 2002-2004 (avg of 2 polls) 2008-2009 (avg of 7 polls) Feb 2016 SOURCE: KFF Polls. See toplines for full question wording and response options.
Figure 3 Public More Likely To Favor Than To Oppose A National Medicare-for-all Health Plan Do you favor or oppose having a national health plan, sometimes called Medicare-for-all, in which all Americans would get their insurance from a single government plan? 100% Favor Oppose 80% May 56% Apr 54% 56%57%56% 56% 59% 51%53%51%53%56%Feb 57%55% 60% 52% 40% 42% 45%47%43% 41%Feb 42%37%39%38% May 41% 43% Apr 41% 44% 38% 38% 20% 0% Jun-2017 Sep-2017 Dec-2017 Mar-2018 Jun-2018 Sep-2018 Dec-2018 Mar-2019 Jun-2019 Sep-2019 Dec-2019 Mar-2020 SOURCE: KFF Health Tracking Polls. See topline for full question wording and response options.
Figure 4 Partisans Divided With Three-Fourths Of Republicans Opposing Medicare-for-all While Eight In Ten Democrats Favor It Do you favor or oppose having a national health plan, sometimes called Medicare-for-all, in which all Americans would get their insurance from a single government plan? Strongly favor Somewhat favor Somewhat oppose Strongly oppose Total 32% 25% 10% 30% Democrats 49% 29% 9% 10% Independents 33% 28% 25% 12% 13% Republicans 11% 11% 63% SOURCE: KFF Health Tracking Poll (conducted May 13-18, 2020). See topline for full question wording.
Figure 5 Terminology Affects Public Opinion On A National Health Plan Do you have a positive or negative reaction to each of the following terms? No opinion Positive Negative Universal health coverage 63% 31% 6% Medicare-for-all 63% 34% 3% National health plan 59% 36% 5% Single-payer health insurance system 32% 49% 19% Socialized medicine 11% 46% 44% SOURCE: KFF Health Tracking Poll (April 11-16, 2019). See topline for full question wording and response options.
Figure 6 Medicare-for-all, Universal Coverage, National Health Plan Garner Most Positive Reactions Percent who say they have a positive reaction to each of the following terms: Total Republicans Independents Democrats 87% Medicare-for-all 33% 62% 63% 63% Universal health coverage 39% 83% 59% National health plan 34% 57% 59% 87% Single-payer health insurance system 39% 47% 49% 64% 17% 45% 46% 74% Socialized medicine SOURCE: KFF Health Tracking Poll (April 11-16, 2019). See topline for full question wording and response options.
Figure 7 Reasons For Opinions On National Health Plan Echo Partisan Messages AMONG THE 39% WHO OPPOSE: What is the main reason you oppose such a plan? AMONG THE 56% WHO FAVOR: What is the main reason you favor such a plan? Medicare-for-all NET: 40% Don t want government involved 23% Health care is a right 7% Universal coverage 34% Oppose 39% Too expensive to implement 14% Favor 56% DK/Ref. 5% Make health care more affordable/ Costs too high 17% Limits 14% choice/competition SOURCE: KFF Health Tracking Poll (March 13-18, 2019). See topline for full question wording and response options.
Figure 8 Universal Coverage Is Most Important Feature Of A National Health Plan Among Supporters How importantis it that a national health plan ? Very important Somewhat important Not too important Not at all important 1% Covers all Americans 89% 9% 1% 1% Simplifies the health care system 79% 18% 2% Eliminates monthly premiums 56% 33% 8% 2% Eliminates out-of-pocket costs like co-pays and deductibles 56% 32% 8% 3% Shifts what people pay for health care to taxes 45% 38% 8% 6% Eliminates private health insurance companies 38% 29% 19% 11% NOTE: Among those who favor a national health plan. SOURCE: KFF Health Tracking Poll (March 13-18, 2019). See topline for full question wording and response options.
Figure 9 Attitudes Shift After Hearing Messages About How Medicare-for- all Would Impact Current System Would you favor or oppose a national Medicare-for-all plan if you heard that it would do each of the following? Oppose Favor Lead to delays in people getting some medical 70% 26% tests and treatments Threaten the current Medicare 60% 32% program Require most Americans to pay 60% 37% more in taxes Eliminate private health insurance 58% 37% companies Eliminate all health insurance premiums and reduce out- of-pocket health care costs for most Americans 30% 67% Guarantee health insurance as a right for all 27% 71% Americans SOURCE: KFF Health Tracking Poll (January 9-14, 2019). See topline for full question wording and response options.
Figure 10 Some Moderate Shifts In Support For Medicare-for-all Depending On Description Of Plan Would you favor or oppose a national Medicare-for-all plan if you heard it would Favor Oppose Eliminate private health insurance, but allow people to choose their doctors, hospitals, and other medical providers 54% 43% Require many employers and some individuals to pay more in taxes, but eliminate health insurance premiums and deductibles for all Americans 48% 48% Increase the taxes that you personally pay, but decrease your overall costs for health care 47% 48% SOURCE: KFF Health Tracking Poll (conducted November 7-12, 2019). See topline for full question wording and response options.
Figure 11 Most Medicare-for-all Supporters Think They Would Be Able To Keep Their Health Insurance Yes, think they and their family would be able to keep their current health insurance No, think they and their family would not be able to keep their current health insurance Among those who favor having a national health insurance plan or Medicare-for-all Among those who oppose having a national health insurance plan or Medicare-for-all Total 24% 35% 51% 55% 67% 41% DK DK DK SOURCE: KFF Health Tracking Poll (January 9-14, 2019). See topline for full question wording and response options.
Figure 12 More Democrats Prefer Candidate Who Would Build On The ACA Thinking about the Democratic candidates approach to health care. Would you prefer to vote for a candidate who wants to ? Replacing the ACA with Medicare-for- all 40% Build on the existing ACA 55% DK/Ref./Other 5% NOTE: Among Democrats and Democratic-leaning independents. SOURCE: KFF Health Tracking Poll (September 3-8, 2019). See topline for full question wording and response options.
Figure 13 More Incremental Approach To Universal Coverage: Medicare Buy- In And Medicaid Buy-In allowing people between the ages of 50 and 64 to buy insurance through the Medicare program? allowing people who don t get health insurance at work to buy health insurance through their state Medicaid program? Do you favor or oppose Oppose Favor 18% 75% Total 18% 77% Democrats 12% 85% 12% 85% Independents 20% 75% 19% 75% 26% 64% Republicans 26% 69% SOURCE: KFF Health Tracking Poll (January 9-14, 2019). See topline for full question wording and response options.
Figure 14 Majorities Of Democrats And Independents Favor Medicare-for- all And Public Option While Majorities Of Republicans Oppose A government-administered health plan, sometimes called a public option, that would compete with private health insurance plans and be available to all Americans A national health plan, sometimes called Medicare-for-all, in which all Americans would get their insurance from a single government plan Strongly oppose Strongly favor Somewhat favor Somewhat oppose Total 35% 32% 11% 17% 32% 25% 10% 30% Democrats 49% 29% 9% 10% 48% 35% 8% 5% Independents 33% 28% 12% 25% 39% 31% 13% 13% Republicans 11% 13% 11% 63% 16% 28% 13% 39% SOURCE: KFF Health Tracking Poll (conducted May 13-18, 2020). See topline for full question wording.
Figure 15 Most Expect Taxes To Increase, Deductibles And Co-Pays To Continue Under Both Medicare-for-all And Under A Public Option Percent who say each of the following would happen if the country had a government- administered health plan, sometimes called a public option, available to all Americans under a national health plan, sometimes called Medicare-for-all 81% 83% Taxes for most people would increase Individuals and employers would continue to pay health insurance premiums 44% 50% All U.S. residents would have health insurance coverage 53% 62% People would continue to pay deductibles and co-pays when they use health care services 61% 68% People who buy their own insurance would be able to keep their current plans 48% 59% People with insurance through their jobs would be able to keep their current plans 47% 60% SOURCE: KFF Health Tracking Poll (January 16-22, 2020). See topline for full question wording and response options.
Figure 16 About Half Favor Both Medicare-for-all And A Public Option Oppose BOTH Medicare- for-all, and public option 22% Favor BOTH Medicare- for-all, and public option 49% Favor public option, Oppose Medicare-for-all 19% 7% 3% Favor Medicare-for-all, Oppose public option DK/Ref. SOURCE: KFF Health Tracking Poll (conducted May 13-18, 2020). See topline for full question wording.