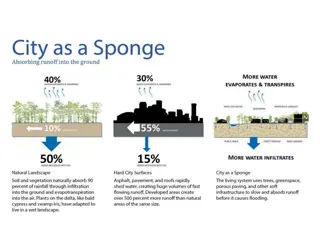
Puerto Rico Commercial and Recreational Fishing Landings Data
Explore the detailed data on commercial and recreational fishing landings in Puerto Rico for the years 2010-2011. The data includes various species such as conch, grouper, parrotfish, snapper, angelfish, goatfishes, grunts, and more. Understand the annual catch limits, percentage of ACL, and trends over the years. Dive into the statistics of both commercial and recreational fishing activities in Puerto Rico.

Download Presentation

Please find below an Image/Link to download the presentation.
The content on the website is provided AS IS for your information and personal use only. It may not be sold, licensed, or shared on other websites without obtaining consent from the author. If you encounter any issues during the download, it is possible that the publisher has removed the file from their server.
You are allowed to download the files provided on this website for personal or commercial use, subject to the condition that they are used lawfully. All files are the property of their respective owners.
The content on the website is provided AS IS for your information and personal use only. It may not be sold, licensed, or shared on other websites without obtaining consent from the author.
E N D
Presentation Transcript
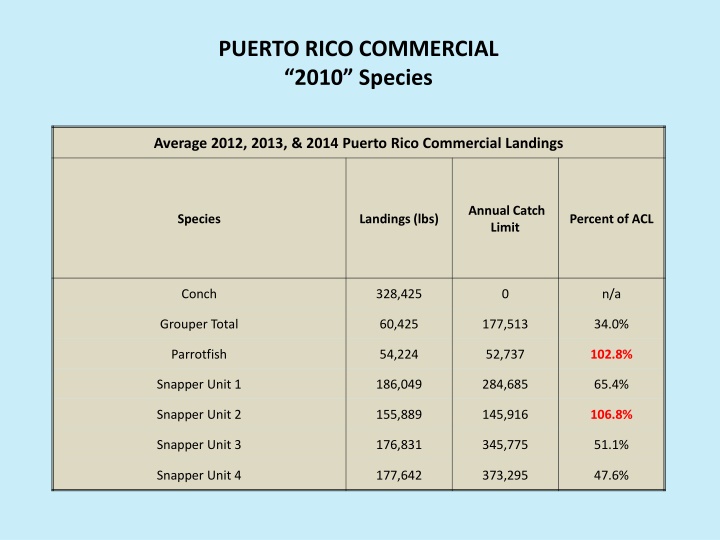
PUERTO RICO COMMERCIAL 2010 Species Average 2012, 2013, & 2014 Puerto Rico Commercial Landings Annual Catch Limit Species Landings (lbs) Percent of ACL Conch 328,425 0 n/a Grouper Total 60,425 177,513 34.0% Parrotfish 54,224 52,737 102.8% Snapper Unit 1 186,049 284,685 65.4% Snapper Unit 2 155,889 145,916 106.8% Snapper Unit 3 176,831 345,775 51.1% Snapper Unit 4 177,642 373,295 47.6%
PUERTO RICO COMMERCIAL 2011 Species Average 2012,2013, & 2014 Puerto Rico Commercial Landings Species Landings (lbs) Annual Catch Limit Percent of ACL Angelfish Aquarium trade* Boxfish Goatfishes Grunts Jacks Porgies Spiny Lobster Squirrelfish Surgeonfish Tilefish* Triggerfish & Filefish 0 0 8,984 8,155 86,115 17,565 182,396 86,059 24,739 327,920 16,663 7,179 14,642 58,475 0.0% 0.0% 47.6% 47.2% 15.0% 48.1% 93.4% 105.5% 41.7% 0.3% 0.0% 121.3% 40,990 8,293 27,377 41,435 23,115 345,997 6,942 22 0 70,926 Wrasses 59,194 54,147 109.3% *Aquarium trade and tilefish ACLs do not contain recreational landings, only commercial landings
PUERTO RICO RECREATIONAL 2010 Species Average Annual 2012, 2013, and 2014 Recreational Landings by Two-month Wave* Annual Catch Limit Percent of ACL Species Total Reported Jan-Feb Mar-Apr May-Jun Jul-Aug Sep-Oct Nov-Dec Goliath Grouper 0 0 0 0 0 0 0 0 n/a Nassau Grouper 80 0 0 2,239 0 0 2,319 0 n/a Grouper 7,773 3,907 4,029 1,304 1,793 200 19,006 77,213 24.6% Parrotfish 2,931 1,004 1,510 6,655 838 1,858 14,795 15,263 96.9% Snapper Unit 1 4,523 4,758 10,175 8,647 1,660 0 29,764 95,526 31.2% Snapper Unit 2 2,460 0 0 0 0 0 2,460 34,810 7.1% Snapper Unit 3 14,779 7,666 21,167 5,938 3,911 12,096 65,557 83,158 78.8% Snapper Unit 4 2,482 2,008 3,018 844 149 1,696 10,196 28,509 35.8% *Recreational landings are reported in whole weight and only available for Puerto Rico
PUERTO RICO RECREATIONAL 2011 Species Average Annual 2012, 2013, and 2014 Recreational Landings by Two-month Wave* Annual Catch Limit Percent of ACL Species Total Reported 126 773 1,297 46 2,493 62,537 2,112 272 0 139 13,463 4,206 Jan-Feb Mar-Apr May-Jun Jul-Aug Sep-Oct Nov-Dec Angelfish Aquarium trade** Boxfish Goatfishes Grunts Jacks Porgies Squirrelfish Surgeonfish Tilefish** Triggerfish & Filefish Wrasses 126 285 314 0 185 16,813 52 0 0 0 4,011 780 0 0 0 0 0 0 0 4,492 8,155 4,616 362 5,028 51,001 2,577 3,891 3,590 14,642 21,929 5,050 2.8% 9.5% 28.1% 12.8% 49.6% 122.6% 82.0% 7.0% 0.0% 1.0% 61.4% 83.3% 219 270 0 579 10,073 156 0 0 0 2,387 1,266 24 408 0 368 4,338 0 0 0 62 4,312 1,675 246 81 0 170 12,211 360 0 0 0 0 0 189 46 651 10,177 375 195 0 0 1,288 15 36 0 540 8,925 1,169 77 0 77 1,464 470 *Recreational landings are reported in whole weight and only available for Puerto Rico **Aquarium trade and tilefish ACLs do not contain commercial landings, only recreational landings
St. Croix 2010 Species Average 2012, 2013, & 2014 St. Croix Commercial Landings Annual Catch Limit Species Landings (lbs) Percent of ACL Conch 27,233 50,000 54.5% Grouper 22,342 30,435 73.4% Parrotfish 100,547 240,000 41.9% Snapper 59,080 102,946 57.4%
St. Croix 2011 Species Average 2012, 2013, & 2014 St. Croix Commercial Landings Species Landings (lbs) Annual Catch Limit Percent of ACL Angelfish 9,515 305 3119.6% Aquarium trade 157 8,155 1.9% Boxfish 1,541 8,433 18.3% Goatfishes 376 3,766 10.0% Grunts 17,912 36,881 48.6% Jacks 9,067 15,489 58.5% Porgies 96 4,638 2.1% Spiny Lobster 62,025 107,307 57.8% Squirrelfish 458 121 378.3% Surgeonfish 14,503 33,603 43.2% Tilefish 0 14,642 0.0% Triggerfish & Filefish 15,146 24,980 60.6% Wrasses 9 7 128.6%
St. Thomas/St. John 2010 Species Average 2012, 2013, and 2014 St. Thomas/St. John Commercial Landings Annual Catch Limit Species Landings (lbs) Percent of ACL Conch 380 0 n/a Grouper 39,054 51,849 75.3% Parrotfish 16,910 42,500 39.8% Snapper 46,906 133,775 35.1%
St. Thomas/St. John 2011 Species Average 2012,2013, & 2014 St. Thomas/St. John Commercial Landings Species Landings (lbs) Annual Catch Limit Percent of ACL Angelfish 17,563 7,897 222.4% Aquarium trade 18 8,155 0.2% Boxfish 11,290 27,880 40.5% Goatfishes 12 320 3.6% Grunts 12,973 37,617 34.5% Jacks 38,259 52,907 72.3% Porgies 70 21,819 0.3% Spiny Lobster 85,938 104,199 82.5% Squirrelfish 9,401 4,241 221.7% Surgeonfish 13,517 29,249 46.2% Tilefish 0 14,642 0.0% Triggerfish & Filefish 45,999 74,447 61.8% Wrasses 2,117 585 362.0%
Stocks or Stock Complexes with ACL Overages Average Annual Landings (2012-2014) Relative to the ACL Average Annual Landings (lbs) Annual Catch Limit (lbs) Species or Complex ACL Overage (lbs) PR Commercial Queen Conch 258,536 0 258,536 PR Commercial Parrotfish 54,224 52,737 1,487 PR Commercial Snapper Unit 2 155,889 145,916 9,973 PR Spiny Lobster 345,997 327,920 18,077 PR Commercial Triggerfish & Filefish 70,926 58,475 12,451 PR Commercial Wrasse 59,194 54,147 5,047 PR Recreational Jacks 62,537 51,001 11,536 STT/STJ Queen Conch 380 0 380 STX Angelfish 9,515 305 9,210 STX Squirrelfish 458 121 337 STX Wrasses 9 7 2 STT/STJ Angelfish 17,563 7,897 9,666 STT/STJ Squirrelfish 9,401 4,241 5,160 STT/STJ Wrasses 2,117 585 1,532
Closure Dates Species or Species Group Closure Date Based on 2014 Fishing Rate PR Commercial Parrotfish 18-Dec PR Commercial Snapper Unit 2 24-Oct PR Commercial Spiny Lobster 12-Nov PR Commercial Triggerfish & Filefish 2-Oct PR Commercial Wrasse 27-Oct PR Recreational Jacks 14-Jun
Stocks or Stock Complexes with OFL Overages 2014 Annual Landings Relative to the OFL Overfishing Level (lbs) Species or Complex 2014 Landings (lbs) OFL Overage (%) PR Commercial Snapper Unit 2 174,478 171,666 1.6 PR Commercial Spiny Lobster 376,766 364,356 3.4 PR Commercial Triggerfish and Filefish 71,827 64,972 10.6 PR Recreational Jacks 100,799 56,668 77.9 PR Recreational Scups and Porgies 4,529 2,863 58.2 PR Recreational Triggerfish and Filefish 24,994 24,366 2.6 PR Recreational Wrasses 8,774 5,611 56.4 STX Angelfish 5,386 406 1226.6 STX Squirrelfish 283 134 111.2 STT/STJ Angelfish 20,410 10,529 93.8 STT/STJ Squirrelfish 8,884 4,712 88.5 STT/STJ Wrasses 2,627 650 304.2