Python Package pyam for Energy System Analysis and Visualization
Explore the Python package pyam for analyzing, validating, and visualizing energy system and climate scenarios. Learn about the challenges in scenario analysis scripts and the vision for a Python toolbox in energy and climate modeling.
Download Presentation

Please find below an Image/Link to download the presentation.
The content on the website is provided AS IS for your information and personal use only. It may not be sold, licensed, or shared on other websites without obtaining consent from the author. If you encounter any issues during the download, it is possible that the publisher has removed the file from their server.
You are allowed to download the files provided on this website for personal or commercial use, subject to the condition that they are used lawfully. All files are the property of their respective owners.
The content on the website is provided AS IS for your information and personal use only. It may not be sold, licensed, or shared on other websites without obtaining consent from the author.
E N D
Presentation Transcript
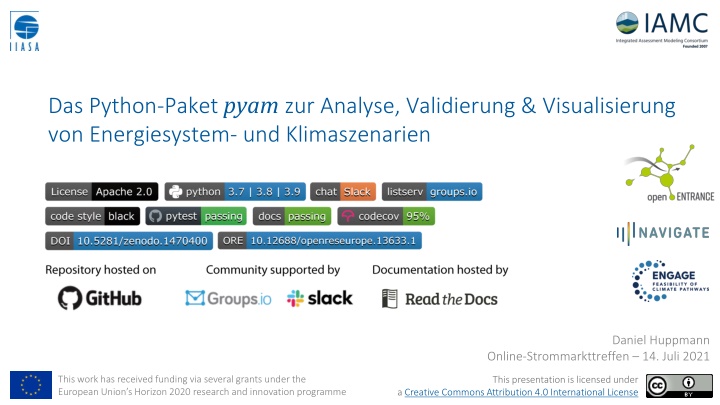
Das Python-Paket pyam zur Analyse, Validierung & Visualisierung von Energiesystem- und Klimaszenarien Daniel Huppmann Online-Strommarkttreffen 14. Juli 2021 This work has received funding via several grants under the European Union s Horizon 2020 research and innovation programme This presentation is licensed under Creative Commons Attribution 4.0 International License a Creative Commons Attribution 4.0 International License
Teil 1 Einleitung & Motivation
Einleitung: von Modellergebnissen zu Analyse Es gibt viele L sungen & Tools zur Szenario-Datenverarbeitung & Visualisierung, aber die meisten sind in ein Modell-Framework integriert oder komplett allgemein Referenzdaten Allgemeine Pakete zur Visualierung Modell z.B. matplotlib, seaborn, ggplot & shiny Integrated-Assessment, Energiesystem, Stromsektor, Landnutzung, andere Sektoren Verarbeitung der Modell-Ergebnisse Datenverarbeitungs- und Analyse-Tools f r ein bestimmtes Modell-Framework Allgemeine Pakete zur Datenverarbeitung Validierung der Szenarien-Ergebnisse z.B. numpy, pandas & tidyverse e.g., TIMES-VEDA, OSeMOSYS, MESSAGEix, REMIND, GCAM, mimi.jl, TEMOA, pypsa, PLEXOS, Evaluierung & Analyse Ergebnisse und wissenschaftliche Publikation 3
Skripte zur Verarbeitung und Analyse von Modell-Ergebnissen Im Gegensatz zu (open-source) Modell-Frameworks folgen interne Skripte zur Szenario-Analyse selten best-practice of scientific software development Das bliche Schema der Erstellung von Skripten zur Analyse von Modellergebnissen: Ein paar Zeilen Code dann noch ein paar Features dann noch ein paar Features Folgen der der inkrementellen Herangehensweise (nicht immer, aber oft) copy-paste von Code-Bl cken von Projekt zu Projekt Kein Versions-Management der Analyse-Skripte Keine (ausreichende) Dokumentation des Codes Keine automatisierten Tests (im Sinne einer continuous-integration-Strategie) Warum ist das ein Problem f r gute Wissenschaft? Kaum Nachvollziehbarkeit, Reproduzierbarkeit und Transparenz der Ergebnisse Risiko von Fehlern/Bugs in existierenden Features bei der Weiterentwicklung Risiko von Fehlern/Bugs durch Updates von verwendeten Software-Paketen 4
Vision: eine Python-Toolbox fr Energie- und Klima-Modellierung Das pyam-Paket bietet eine Reihe an modell-unabh ngigen Funktionen, um die Analyse & Visualisierung von Szenarien zu vereinfachen Design-Prinzip: Harmonisiertes Daten-Modell (=Struktur) Modell-unabh ngige Standard-Funktionen zur Analyse & Visualisierung Modulare Paket-Architektur und einfache Integration von/in andere Python-Pakete Vorteile f r Modelierer innen: Standardisiertes Interface orientiert an pandas & matplotlib f r effiziente Analyse Umfangreiche Dokumentation, Tutorials, Mail-Verteiler, Slack-Workspace, Performante interne Implementierung als pandas.Series statt pandas.DataFrame Verbesserte Transparenz & Nachvollziehbarkeit durch k rzere Analyse-Skripte Erh hte Zuverl ssigkeit durch umfangreiche Tests & continuous-integration-Strategie 5
Teil 2 Das pyam-Paket und das zugrunde liegende Daten-Modell 6
Supported data models and file formats The package supports various formats & types of timeseries data and is currently used by more than a dozen modelling teams Supported timeseries data formats: The pyam package was initially developed to work with the IAMC template, a tabular format for yearly timeseries data But the package also supports sub-annual time resolution Continuous-time formats (e.g., hourly timeseries data) Representative sub-annual timeslices (e.g., winter-night ) Compatible i/o and file formats: Full integration with the pandas data analysis package Tabular data(xlsx, csv)& frictionless datapackage format 7
The pyam package for integrated assessment & macro-energy modelling A community package for scenario processing, analysis & visualization following best practice of collaborative scientific software development Use cases and features Data processing Data i/o & file format conversion, aggregation, downscaling, unit conversion, Validation Checks for completeness of data, internal/external consistency, numerical plausibility Analysis & visualization Categorization and statistics of scenario ensembles, plotting library, D. Huppmann, M. Gidden, et al. (2021). Open Research Europe 1 1:74. doi: 10.12688/openreseurope.13633.1 #pyam_iamc #pyam_iamc pyam-iamc.readthedocs.io 8
Teil 3 Rule number 1 of live demos never do a live demo 9
Thank you very much for your attention! Read the docs on pyam-iamc.readthedocs.io Join the mailing list on groups.io or the Slack workspace Dr. Daniel Huppmann Create an issue or start a pull request on github.com/IAMconsortium/pyam/ Research Scholar Energy, Climate, and Environment Program (ECE) International Institute for Applied Systems Analysis (IIASA) Schlossplatz 1, A-2361 Laxenburg, Austria huppmann@iiasa.ac.at huppmann@iiasa.ac.at @daniel_huppmann www.iiasa.ac.at/staff/huppmann @daniel_huppmann www.iiasa.ac.at/staff/huppmann This presentation is licensed under Creative Commons Attribution 4.0 International License a Creative Commons Attribution 4.0 International License
Feature support & ongoing development We are committed to support more use cases & applications Time domain Standard IAMC format: yearly data Subannual timeslices e.g., representative days Continuous-time format e.g., ISO 8601, Python datetime File types tabular data (xlsx, csv) frictionless data format database format (netcdf) Additional extra columns import file with non-standard index or columns Directional data use > in the region column (e.g., Germany>France) Metadata and license info Provenance tracking Fully tested & documented Experimental support Not (yet) implemented 12
The variable column The IAMC data format uses the variable column to implement a semi-hierarchical structure The variable column can be used to implement a hierarchical tree Aggregate: Primary Energy Subcategory: Primary Energy|Coal Further detail: Primary Energy|Coal|w/CCS The package offers many tools to work with such hierarchical trees df.filter(variable= Primary Energy* , level=1) df.aggregate(variable= Primary Energy ) Read the docs for more information: https://pyam-iamc.readthedocs.io/en/stable/data.html 13
Good practice for scenarios ensemble analysis As part of the effort supporting the IPCC SR15 assessment, we wrote a list of do s and don ts for model/scenario comparison A A user s user s guide guideto to the theanalysis analysis and andinterpretation interpretationof of ( (unstructured unstructured) ) scenario scenarioensembles ensembles Don t interpret the scenario ensemble as a statistical sample or as likelihood/agreement. Don t focus only on the medians, but consider the full range over the scenario set. Don t cherry-pick individual scenarios to make general conclusions. Don t over-interpret scenario results & don t venture too far from the original question. Don t conclude that the absence of a particular scenario (necessarily) means that this scenario is not feasible or possible. Based on Box 1, Huppmann et al., Nature Climate Change 8:1027-1030 (2018). doi: 10.1038/s41558-018-0317-4 | open-access version: https://rdcu.be/9i8a 14

