Quality Assessment of Census Data
This collection of resources delves into evaluating the quality of census data, focusing on methods, types of errors, preliminary checks, and handling missing age and sex information. It covers topics such as checks based on one census, proportionate redistribution, and practical examples like the Nepal 2001 census data.

Download Presentation

Please find below an Image/Link to download the presentation.
The content on the website is provided AS IS for your information and personal use only. It may not be sold, licensed, or shared on other websites without obtaining consent from the author. If you encounter any issues during the download, it is possible that the publisher has removed the file from their server.
You are allowed to download the files provided on this website for personal or commercial use, subject to the condition that they are used lawfully. All files are the property of their respective owners.
The content on the website is provided AS IS for your information and personal use only. It may not be sold, licensed, or shared on other websites without obtaining consent from the author.
E N D
Presentation Transcript
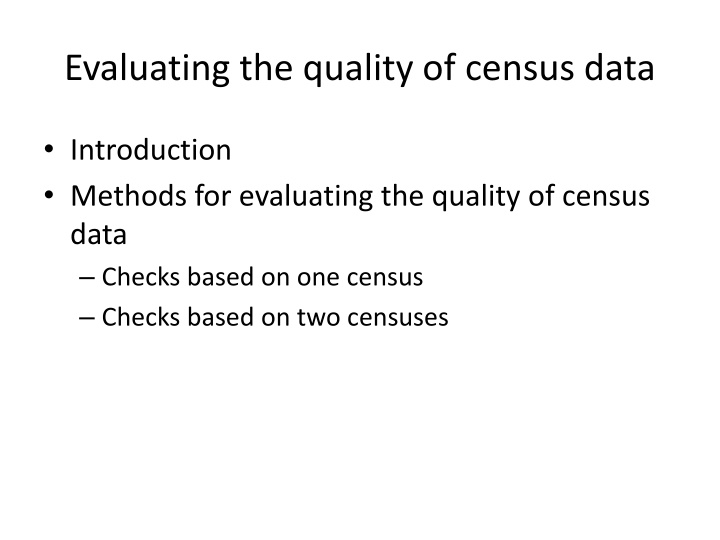
Evaluating the quality of census data Introduction Methods for evaluating the quality of census data Checks based on one census Checks based on two censuses
Introduction Evaluation of data quality is a very important part of demographic methods Methods censuses and vital registration data Evaluation for the purpose of making adjustments to the data Related to indirect estimation methods
Types of errors Coverage errors Whether the event or population is recorded or not (or double-counted) Content errors Accuracy of variables associated with the record (age, cause of death, etc.)
Evaluating census data Preliminary checks Operational practices and difficulties experienced Policies and practices for cleaning and editing the data prior to release Social, economic, historical, political, epidemiological context
Missing age and sex Evaluate extent of missing information on age and sex If no missing ages in released data, determine procedure that was used for imputation If missing ages in released data, decide on procedure for treating missing ages
Proportionate redistribution Nx= enumerated population aged x Nm= enumerated population with missing age Nx*= adjusted population age x
Checks based on one census Produce figures with age- and sex- distributions to identify age heaping and size of male vs. female population By 1-year age groups By 5-year age groups
Example: Nepal 2001 400 1,800 1,600 350 1,400 300 1,200 Population ('000) 250 1,000 200 800 600 150 400 100 200 50 0 0-4 5-9 65-69 95+ 10-14 15-19 20-24 25-29 30-34 35-39 Age group 40-44 45-49 50-54 55-59 60-64 70-74 75-79 80-84 85-89 90-94 0 0 10 20 30 40 50 60 70 80 90 100110 Age Male Female Male Female
Age Ratios Distortions at older ages obscured by smaller cohort sizes Calculate age ratios: If size of age group varies linearly between three consecutive age groups, AR should be close to 100 Deviations from 100 in the absence of exogenous factors (migrations, past calamities) indicate undercount of displacement
Example: Nepal 2001 1.2 1.0 0.8 0.6 0.4 0.2 0.0 5-9 40-44 60-64 80-84 10-14 15-19 20-24 25-29 30-34 35-39 45-49 50-54 55-59 65-69 70-74 75-79 85-89 90-94 Age group Males Females
Sex Ratios Age-specific sex ratios (age x to x+n) nNxm= enumerated males aged x to x+n nNxf= enumerated females aged x to x+n In the absence of international migration and sex-selective abortion, sex ratios should decline slowly over age
Example: Nepal 2001 140 140 120 120 100 100 80 80 60 60 40 40 20 20 0 0 0-4 5-9 95+ 10-14 15-19 20-24 25-29 30-34 35-39 Age group 40-44 45-49 50-54 55-59 60-64 65-69 70-74 75-79 80-84 85-89 90-94 0 10 20 30 40 50 60 70 80 90100110 Age
Comparison with data from UN Population Division Compare census age and sex distribution with distribution for comparable years from most recent UN World Population Prospects UN WPP does not represent truth, but comparison may help detect patterns of errors
Checks based on two censuses One-census analysis makes it difficult to make distinction between real irregularities in age distributions vs. data errors The use of two censuses helps clear up these uncertainties First check: calculation intercensal population growth rate
Cohort survival ratios In the absence of migration, cohort size from one census to the next should only decrease in a regular pattern Irregular patterns of cohort survival can be due to: Net migration Change in country boundaries Change in covered population (inclusion of military, nationals living abroad, etc.) Errors If large immigration, analyze cohorts survival among native-born population separately
Cohort survival ratios t = time of the first census t+a = time of the second census a = length of the intercensal period nNx(t) = population aged x to x+n at first census nNx+a(t+a) = population aged x+a to x+a+n at the second census (=size of same cohort at the second census)