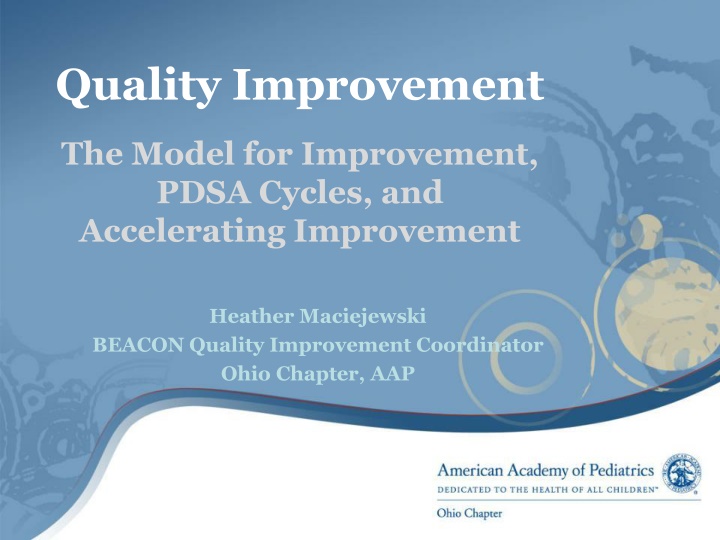
Quality Improvement
Explore the components of Quality Improvement using the Model for Improvement, PDSA Cycles, and Key Driver Diagrams. Learn how to set goals, test change ideas, and accelerate improvement in healthcare settings.

Download Presentation

Please find below an Image/Link to download the presentation.
The content on the website is provided AS IS for your information and personal use only. It may not be sold, licensed, or shared on other websites without obtaining consent from the author.If you encounter any issues during the download, it is possible that the publisher has removed the file from their server.
You are allowed to download the files provided on this website for personal or commercial use, subject to the condition that they are used lawfully. All files are the property of their respective owners.
The content on the website is provided AS IS for your information and personal use only. It may not be sold, licensed, or shared on other websites without obtaining consent from the author.
E N D
Presentation Transcript
Quality Improvement The Model for Improvement, PDSA Cycles, and Accelerating Improvement Heather Maciejewski BEACON Quality Improvement Coordinator Ohio Chapter, AAP
Session Objectives To describe the components of the Model for Improvement To identify measures and goals for your participation in EASE To develop a clear plan for your team to test a change idea To identify future tests of change
QUALITY IMPROVEMENT STRUCTURE, APPROACH AND ROADMAP
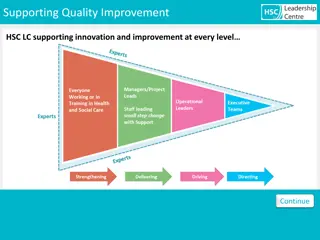
Structure is Based on Institute for Healthcare Improvement (IHI) Breakthrough Series Supports: Experts Learning Session Action Period Calls Telephone Email Monthly Reports Monthly Data Select a Quality Improvement Topic Conduct Expert Meeting Develop Framework and Changes Planning Group (Experts) Spread and Dissemination Participants (YOU!) Holding the Gains Learning Session Action Period Calls
Approach is Based on The Model for Improvement Model for Improvement What are we trying to accomplish? How will we know that a change is an improvement? What change can we make that will result in improvement? Act Plan Study Do The Improvement Guide Associates in Process Improvement
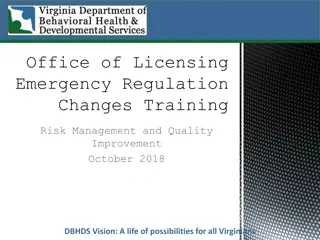
Key Driver Diagram Medical Directors: Sarah Denny, MD and Michael Gittelman, MD Principal Investigator: Jamie Macklin, MD Updated: April 3, 2014 INTERVENTIONS KEY DRIVERS SMART AIM CHEX Quality Board Tips Nurse champions/RN care partners Scripting for and with parents Safe Sleep Cheat Sheet Nursing Education By February 28, 2015, at least 90% of children less than 1 year of age who are sleeping at a participating Ohio Children s Hospital, will be found in a safe sleep position on random weekly audits. Multi-Disciplinary (PCA, OT/PT) Education Grand Rounds Hospital pediatricians web module A safe sleep position includes: Sleeping in his/her own crib Alone in the crib Laying on his/her back Physician Education Safety Videos/Edutainment System (Franklin County/CPSC/NICHD) Take-home magnets Brochures Safe Sleep posters Parent/Caregiver Education GLOBAL AIM Management of Environment Sleep sacks Safe Sleep Policy developed Assess hospital policy on clothing allowed for patients Mattresses on beds need evaluated Potentially use fitted sheets on beds Provide children with the opportunity to grow up to reach their fullest potential by eliminating death or injury due to unsafe sleep habits. Key Driver Diagram adapted from Nationwide Children s Hospital
THE MODEL FOR IMPROVEMENT
The Model for Improvement Model for Improvement What are we trying to accomplish? Part 1: Answers these three questions How will we know that a change is an improvement? What change can we make that will result in improvement? Part 2: Guides change to see if there is an improvement Act Plan Study Do The Improvement Guide Associates in Process Improvement
The Model for Improvement Model for Improvement What are we trying to accomplish? Set Aims Part 1: Answers these three questions How will we know that a change is an improvement? Establish Measures Select Changes What change can we make that will result in improvement? Part 2: Guides change to see if there is an improvement Act Plan Test the Changes Study Do The Improvement Guide Associates in Process Improvement
The Model for Improvement Model for Improvement What are we trying to accomplish? Aim How will we know that a change is an improvement? What change can we make that will result in improvement? Act Plan Study Do The Improvement Guide Associates in Process Improvement
Aim Statements Provides a focused rationale and vision for what your team plans to accomplish Are SMART S: Specific M: Measurable A: Action-Oriented R: Relevant/Realistic T: Timely
Key Driver Diagram Medical Directors: Sarah Denny, MD and Michael Gittelman, MD Principal Investigator: Jamie Macklin, MD Updated: April 3, 2014 INTERVENTIONS KEY DRIVERS SMART AIM CHEX Quality Board Tips Nurse champions/RN care partners Scripting for and with parents Safe Sleep Cheat Sheet Nursing Education By February 28, 2015, at least 90% of children less than 1 year of age who are sleeping at a participating Ohio Children s Hospital, will be found in a safe sleep position on random weekly audits. Multi-Disciplinary (PCA, OT/PT) Education Grand Rounds Hospital pediatricians web module A safe sleep position includes: Sleeping in his/her own crib Alone in the crib Laying on his/her back Physician Education Safety Videos/Edutainment System (Franklin County/CPSC/NICHD) Take-home magnets Brochures Safe Sleep posters Parent/Caregiver Education GLOBAL AIM Management of Environment Sleep sacks Safe Sleep Policy developed Assess hospital policy on clothing allowed for patients Mattresses on beds need evaluated Potentially use fitted sheets on beds Provide children with the opportunity to grow up to reach their fullest potential by eliminating death or injury due to unsafe sleep habits. Key Driver Diagram adapted from Nationwide Children s Hospital
Global vs. Specific Aim Statements Education and Sleep Environment (EASE): The Injury Prevention Learning Collaborative with Hospitalists Global Aim: Provide children with the opportunity to grow up to reach their fullest potential by eliminating death or injury due to unsafe sleep habits.
Global vs. Specific Aim Statements Specific Aim: By February 28, 2015, at least 90% of children less than 1 year of age who are sleeping at a participating Ohio Children s Hospital, will be found in a safe sleep position during random weekly audits. A safe sleep position includes a child who is: Sleeping in his/her own crib Sleeping alone in the crib Laying on his/her back
The Model for Improvement Model for Improvement What are we trying to accomplish? How will we know that a change is an improvement? Measures What change can we make that will result in improvement? Act Plan Study Do The Improvement Guide Associates in Process Improvement
Why do we measure? Measures facilitate learning and are not for judgment or comparison Recognize areas for improvement define the gap between where we are and where we need to be Provide feedback as a means to evaluate are the changes we re making having the desired impact? Characterize the robustness of change how does our system respond to the changes we ve made?
Process vs. Outcome Measures Process measures: represents the workings of the system Proportion of patients with hemoglobin A1c levels measured at least twice within the past year Proportion of children with asthma who receive asthma management plan Outcome measures: represents the voice of the customer or patient Reduction in BMI percentile Hospitalizations or ED visits due to asthma Patient satisfaction with time to getting an appointment
EASE Measures EASE process measures include: > 90% of patients 1 year of age and younger will leave the hospital with information on safe sleep practices Each hospital will show that > 90% of children 1 year of age will be in safe sleep position (own crib, nothing in crib and on back) on random weekly audits by the end of the 12-month project This is a bundled measure of all three items for a safe sleep position
The Model for Improvement Model for Improvement What are we trying to accomplish? How will we know that a change is an improvement? Ideas/ Changes What change can we make that will result in improvement? Act Plan Study Do The Improvement Guide Associates in Process Improvement
The Model for Improvement Model for Improvement What are we trying to accomplish? How will we know that a change is an improvement? What change can we make that will result in improvement? P-D-S-A Cycle Act Plan Study Do The Improvement Guide Associates in Process Improvement
PLAN DO STUDY ACT CYCLES
The PDSA Cycle Four Steps: Plan, Do, Study, Act Also known as: Act Plan Shewhart Cycle Deming Cycle Study Do Learning and Improvement Cycle The Improvement Guide Associates in Process Improvement
Use PDSA Test Cycles for: Testing or adapting a change idea May answer a question related to the aim Implementing a change Spreading the changes to the rest of the system
Why Test? Force us to think small Increases your belief that the change will result in improvement Opportunity for learning without impacting performance Help teams adapt good ideas to their specific situation The Improvement Guide Associates in Process Improvement
The PDSA Cycle Act Plan Objective (tie to AIM or Key Driver) Questions and predictions (why) Plan to carry out the cycle (who, what, where, when) Do Study
Key Points for PDSA Cycles Do initial cycles on smallest scale possible Think baby steps a cycle of one usually best Failures are good learning opportunities; can be better than Successes As move to implementation, test under as many conditions as possible Think about factors that could lead to breakdowns, supports needed, naysayers Different providers; different days of the week; different patient populations, etc.
Key Points for PDSA Cycles Do initial cycles on smallest scale and within shortest timeframe possible - Think baby steps a cycle of one usually best Years Quarters Months Weeks Days Hours Minutes Drop down two levels to plan Test Cycle!
The PDSA Cycle Act Plan Objective (tie to AIM or Key Driver) Questions and predictions (why) Plan to carry out the cycle (who, what, where, when) Do Study Carry out the plan Document problems and unexpected observations
The PDSA Cycle Act Plan Objective (tie to AIM or Key Driver) Questions and predictions (why) Plan to carry out the cycle (who, what, where, when) Do Study Complete the analysis of the data Compare data to predictions Summarize what was learned Carry out the plan Document problems and unexpected observations
The PDSA Cycle Act Plan Objective (tie to AIM or Key Driver) Questions and predictions (why) Plan to carry out the cycle (who, what, where, when) Do What changes are to be made? Next cycle? Study Complete the analysis of the data Compare data to predictions Summarize what was learned Carry out the plan Document problems and unexpected observations
Common PDSA Pitfalls 1. Testing changes where link to overall aim or key driver is unclear 2. Failing to make a prediction before testing the change 3. Failing to execute the whole cycle Plan, Plan, Plan-D-S-A (too much planning, not enough doing) P-Do, Do, Do-S-A (too much doing, not enough studying)
Common PDSA Pitfalls 4. Not learning from failures 5. Lack of detailed execution plan 6. Failure to think ahead a few cycles
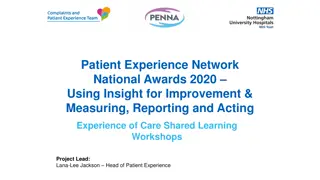
PDSA WORKSHEET Do Plan Team Name: Best Pizza Delivery Team Overall team/project aim: Deliver pizzas within 30 minutes What is the objective of the test? Reduce the number of late deliveries due to drivers getting lost Date of test: January 2nd Test Completion Date: January 5th Act Study PLAN: Briefly describe the test: Provide maps for the delivery drivers to ensure they know the delivery location, and can make it on time How will you know that the change is an improvement? Drivers will deliver pizzas on time without getting lost What driver does the change impact? Getting to delivery location efficiently What do you predict will happen? The maps will help get drivers to their destination efficiently PLAN DO: Test the changes. Was the cycle carried out as planned? X Yes No Record data and observations. 100% of deliveries were made without drivers getting lost What did you observe that was not part of our plan? Day drivers ran into more traffic than expected. STUDY: Did the results match your predictions? XYes No Compare the result of your test to your previous performance: Less drivers were lost because of the maps. What did you learn? Maps are useful for delivery drivers ACT: Decide to Adopt, Adapt, or Abandon. Adapt: Improve the change and continue testing plan. Plans/changes for next test: Provide maps for all shifts, not just day drivers Adopt: Select changes to implement on a larger scale and develop an implementation plan and plan for sustainability Abandon: Discard this change idea and try a different one Person responsible (who) Order Taker List the tasks necessary to complete this test (what) 1. Customer calls in order; person answering phone confirms address 2. Address is given to Manager Joe 3. Map is created for delivery address 4. Map is given to delivery driver 5. Delivery driver follows map to address 6. Delivery driver reports back on getting lost/not getting lost, and time it takes for pizza to be delivered Plan for collection of data: Delivery drivers will keep a log of time they leave the store to the time they arrive at the delivery address; this information will be sent to Manager Joe. When Where Jan. 2nd Clifton Location Clifton Location Clifton Location Clifton Location Clifton Location Clifton Location Order Taker Jan. 2nd Manager Joe Jan. 2nd Manager Joe Jan. 2nd Delivery Driver Jan. 2nd Delivery Driver Jan. 2nd
PDSA Cycle Ramps: Sequential Building of Knowledge Changes That Result in Improvement Successive tests of a change build knowledge AND create a ramp to improvement A P S D Implementation of Change Wide-Scale Tests of Change Best Practice Evidence Hunches Theories Testable Ideas A P S D Follow-up Tests The Improvement Guide Associates in Process Improvement Very Small Scale Test
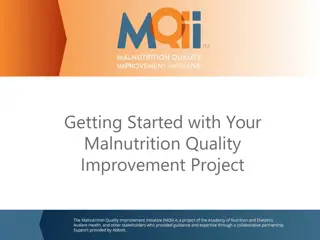
Example of Accelerating Improvement Plan Do Act Stud y Do Plan Act Stud y TEST 4 What: Mapquest Directions Who (population): all shifts Where: Clifton location When: From 1/17 to 1/24 Who Executes: Mgr. Joe Results: Nobody got lost, directions easier than map, but printing and sorting directions still took time; suggested telephone answerer device plan for printing/sorting maps for drivers Plan Do Act Study TEST 3 What: Mapquest Directions Who (population): Day drivers Where: Clifton location When: From 1/14 to 1/17 Who Executes: Mgr. Joe Results: Nobody got lost, directions easier than map but printing out & sorting directions takes time Plan Do Act Study TEST 2 What: Provide maps Who (population): all shifts Where: Clifton location When: From 1/6 to 1/13 Who Executes: Mgr. Joe Results: Nobody got lost but deliveries took longer & some drivers had difficulty using the map TEST 1 What: Provide maps Who (population): Day drivers Where: Clifton location When: From 1/2 to 1/5 Who Executes: Mgr. Joe Results: Nobody got lost
All improvements requires change, but not every change is improvement. The Improvement Guide, 2009
Quality Improvement Videos The Model for Improvement: http://www.youtube.com/watch?v=SCYgh xtioIY PDSA Cycles: http://www.youtube.com/watch?v=_- ceS9Ta820&feature=youtu.be
References Fuller, S. (2010). Model for Improvement. PowerPoint slides Griffin, F. (2004). The PDSA Cycle Testing and Implementing Changes. Retrieved from: www.njha.com/qualityinstitute/pdf/628200432756PM63.ppt PPT file Langley, G., Moen, R., Nolan, K. , Nolan T., Norman, Provost, L. (2009). The Improvement Guide: A Practical Approach to Enhancing Organizational Performance. 2nd edition. Jossey-Bass Publishers., San Francisco. Moen, R. and Norman, C. (2010). Circling back clearing up myths about the Deming cycle and seeing how it keeps evolving. Retrieved from www.qualityprogress. com NHS Institute for Innovation and Improvement. Quality and Service Improvement Tools: PDSA. Retrieved fromhttp://www.institute.nhs.uk/quality_and_service_improvement_tools/quality_and_service_improvement _tools/plan_do_study_act.html Provost, L., Murray, S. (2011). The Health Care Data Guide: Learning from data for Improvement. Jossey- Bass Publishers., San Francisco. Society of Hospital Medicine. Plan-Do- Study- Act. Retrieved from: http://www.hospitalmedicine.org/ResourceRoomRedesign/CSSSIS/html/06Reliable/Plan_study.cfm The Model for Improvement National Primary Care Development Team (2004). Retrieved from: www.npdt.org